
We’ve built a live demo of MigratoryData simulating a realtime stock trading platform. A backend app generates market data for a list of stocks and sends it to MigratoryData. In turn, MigratoryData pushes that market data to the web browser over WebSockets as part of a portfolio-like web app. In this article, we provide a step-by-step guide on how to monitor MigratoryData with Prometheus and Grafana, and present the metrics of the live demo as Grafana dashboard charts.
Live Demo
The realtime stock ticker web app made available in the demo section of this website will be used to exemplify MigratoryData monitoring with Prometheus and Grafana.
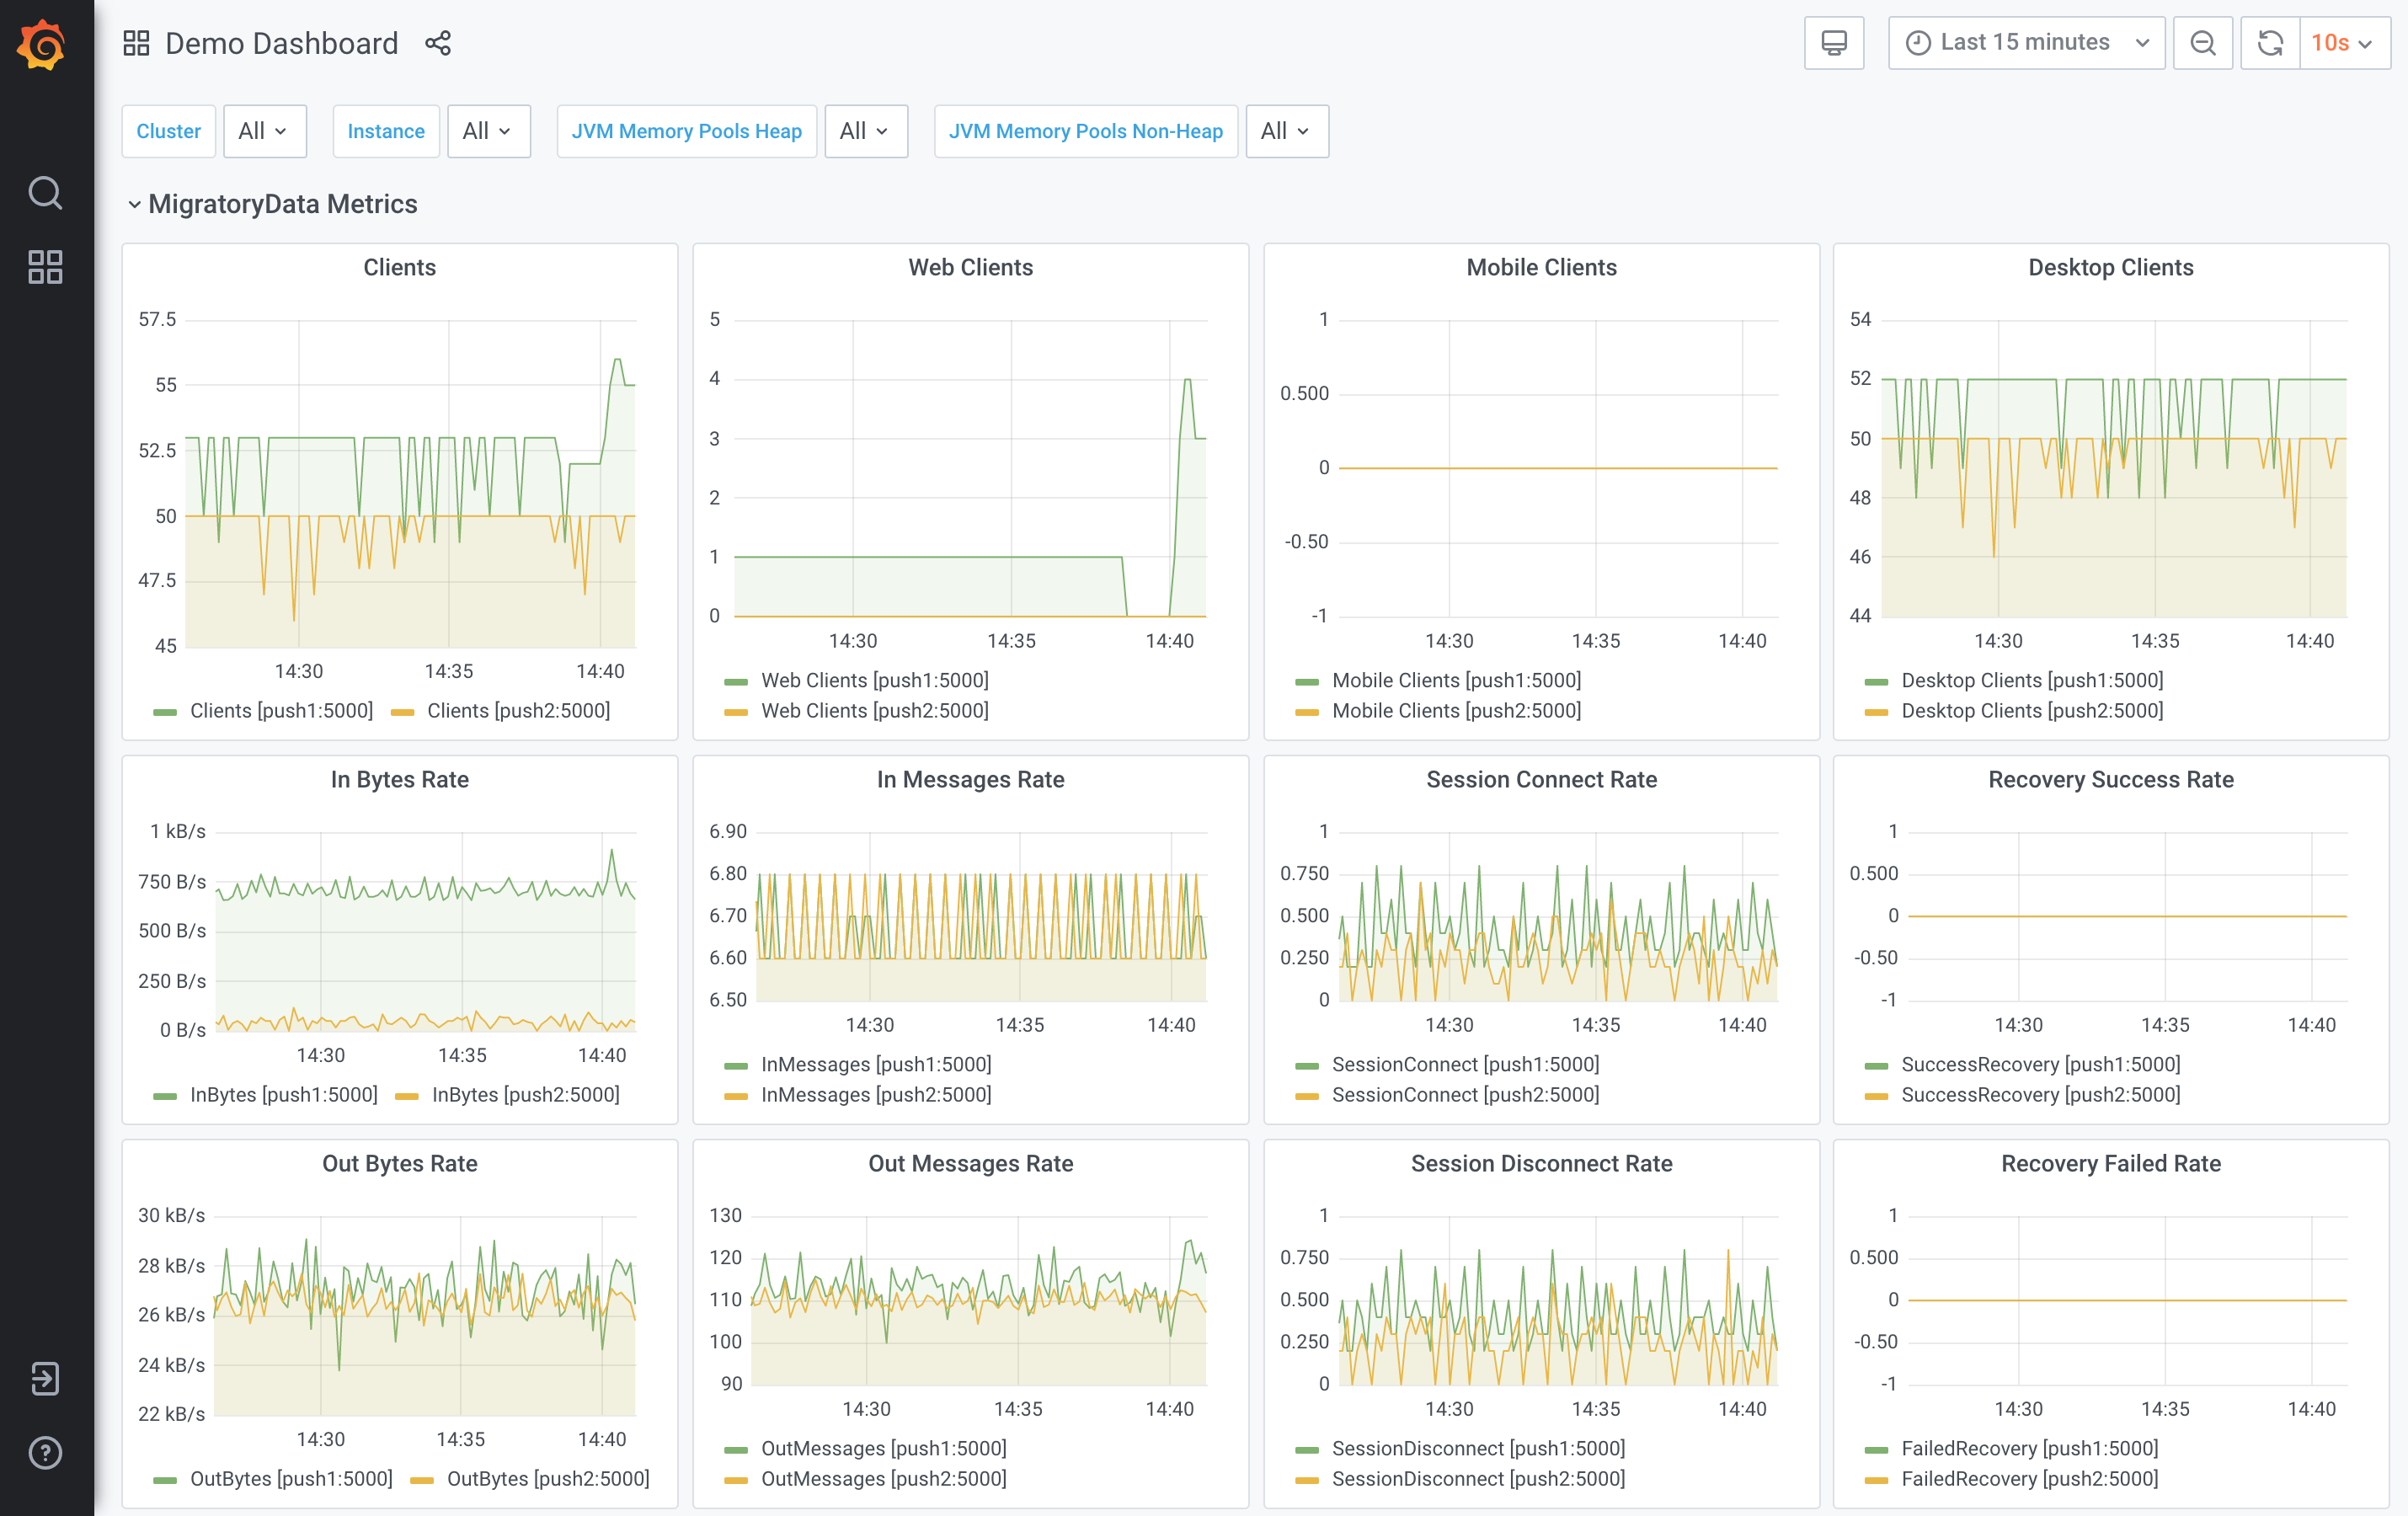
The realtime data of this web app is provided by a market data feed generator which sends realtime data to a cluster of two MigratoryData servers push1 and push2. Also, we simulate about one hundreds traders consuming market data from the MigratoryData cluster. From time to time, some traders disconnect from and new traders connect to the MigratoryData cluster. The Grafana dashboard produced by MigratoryData monitoring with Prometheus and Grafana looks like the following dashboard:
MigratoryData Monitoring
In the just-released MigratoryData version 6.0.4, we’ve added built-in support for Prometheus monitoring, besides the existing monitoring options JMX and HTTP. For any of these three monitoring options, we’ve implemented the possibility to retrieve the various metrics made available by the MigratoryData server either locally or remotely, with or without authentication, and over TLS/SSL encrypted or normal connections.
While the JMX and HTTP monitoring options are based on industry standards and therefore are compatible with the traditional enterprise management systems, the Prometheus monitoring - in combination with Grafana dashboards - tends to become the de-facto standard for modern monitoring.
Installation and configuration
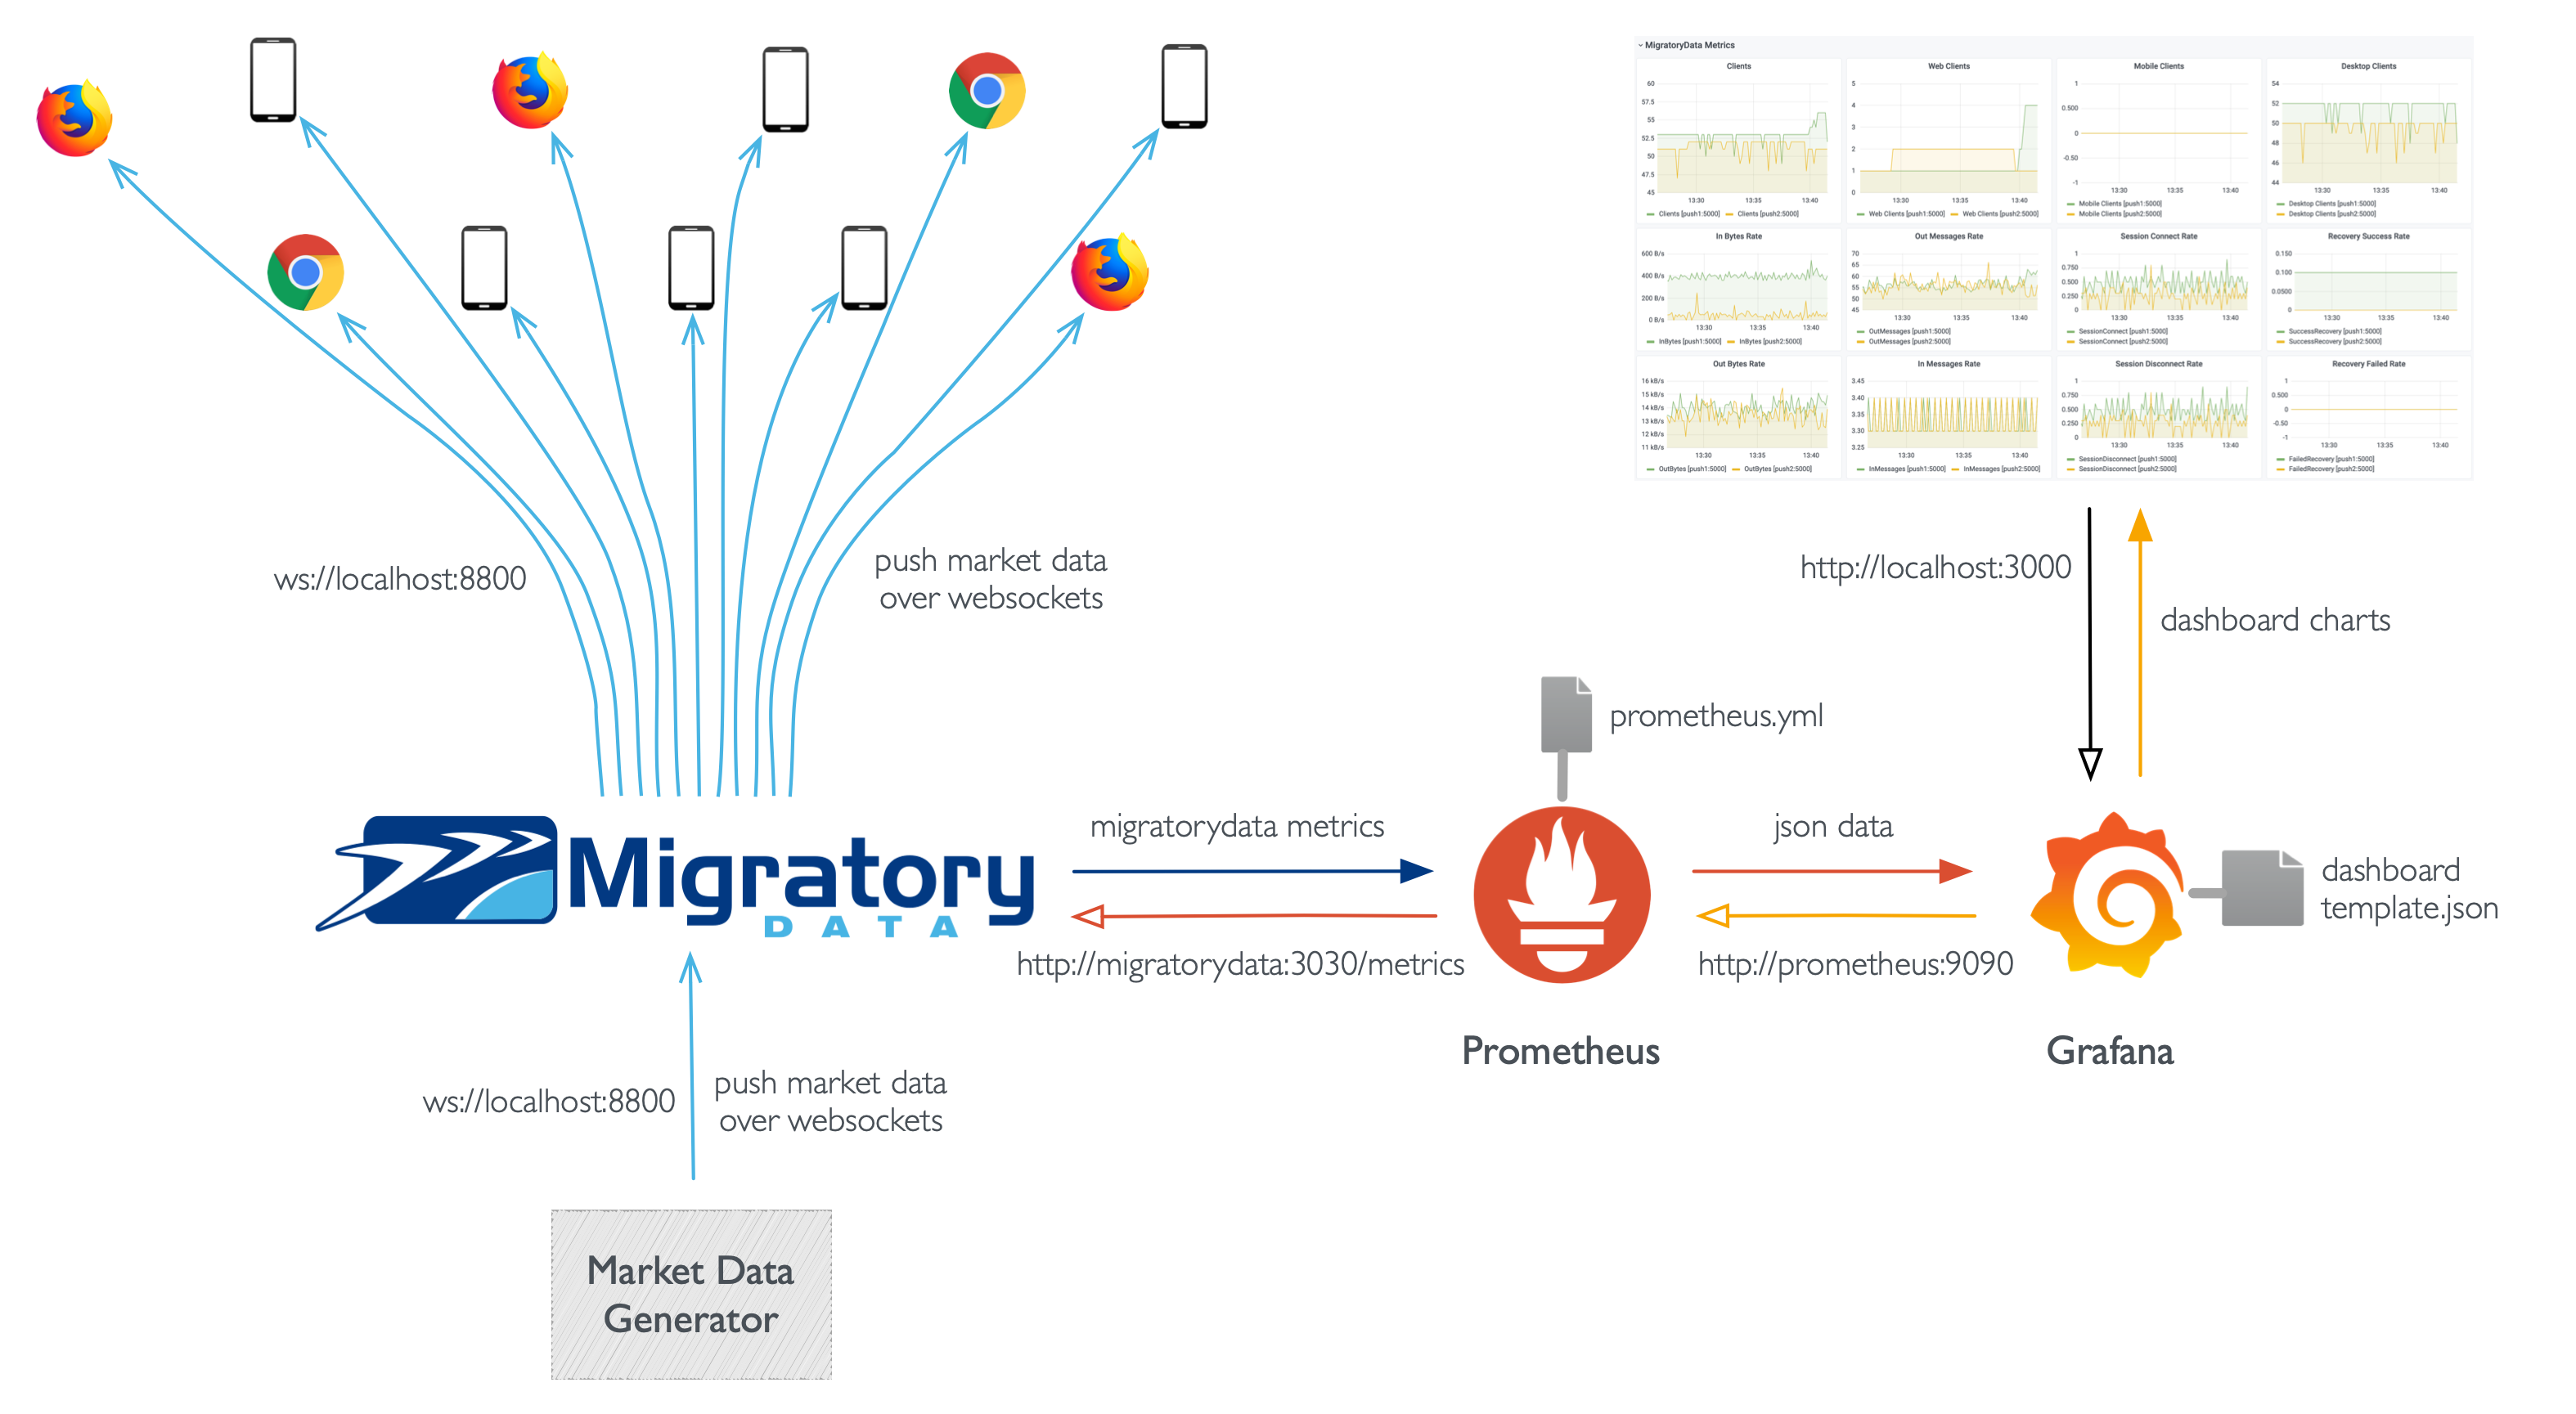
We are going to walk you through the steps necessary to build a setup similar to the one of the live demo introduced above and outlined by the following diagram:
In order to monitor MigratoryData with Prometheus and Grafana, we’ll need the following:
- enable Prometheus monitoring for the MigratoryData servers we want to monitor
- install Prometheus and configure it to gather the metrics of the MigratoryData servers
- install Grafana, configure Prometheus as a data source, and load a dashboard template
For the sake of simplicity, we will deploy a single instance of each of these software products and will install them using Docker. You might choose other installation methods of these software products and adapt the configurations below to that specific installation method.
We will install the three software products as three Docker containers on the same Docker network. In this way, each Docker container will be able to access the three containers through the host name of the containers, without having to deal with the IP addresses of the containers. Let’s name this Docker network migratorydata-network and let’s create it with the following Docker command:
docker network create --driver bridge migratorydata-network
MigratoryData
In order to install an the latest version of the MigratoryData server configured with Prometheus monitoring using authentication, use the following Docker command:
docker run --platform linux/amd64 -d --name migratorydata --network migratorydata-network \
-e MIGRATORYDATA_EXTRA_OPTS="-DLicenseKey=demolicensekey \
-DMonitor=Prometheus \
-DMonitorUsername=admin \
-DMonitorPassword=pass \
-DMonitorPrometheus.Encryption=false \
-DMonitorPrometheus.Listen=migratorydata.migratorydata-network:3030" \
-p 8800:8800 migratorydata/server
In this example, MigratoryData will accept Prometheus connections over normal connections on the port 3030 of the network address migratorydata.migratorydata-network of the Docker network. To configure Prometheus monitoring with encryption, you will need to put the parameter MonitorPrometheus.Encryption on true and add an entry named prometheus for the network address migratorydata.migratorydata-network in the keystore configured with the parameter KeyStore of the MigratoryData server as further described in the Configuration Guide.
The above port 8800 is exposed outside of the Docker network to accept the MigratoryData clients. So, assuming that you executed the command above on your desktop, you can already test your MigratoryData installation by opening in your web browser the following URL:
Otherwise, if you executed the command above on a remote machine, replace localhost in the URL above with the host name or IP address of your remote machine (and make sure the port 8800 is not blocked by the firewall).
Prometheus
Create a configuration file named prometheus.yml in a folder of your choice, say /tmp, as follows:
global:
  scrape_interval: 10s
scrape_configs:
  - job_name: 'migratorydata'
    scheme: http
    metrics_path: '/metrics'
    params:
        username: ['admin']
        password: ['pass']
    static_configs:
      - targets: ['migratorydata.migratorydata-network:3030',]
This configuration fits the parameters you defined in the previous step. More precisely, MigratoryData listens for Prometheus connections on the port 3030 and the network address migratorydata.migratorydata-network as specified by targets, it uses normal http connections (i.e. not encrypted https connections) as defined by scheme and authentication with the credentials admin and pass as specified by username and password.
targets or add multiple entries to scrape_configs.
Assuming the file prometheus.yml you just created is located in the folder say /tmp, create the Docker container for Prometheus with the following command:
docker run --platform linux/amd64 -d --name prometheus --network migratorydata-network \
-v /tmp/prometheus.yml:/etc/prometheus/prometheus.yml \
prom/prometheus
Grafana
Create the Docker container for Grafana with the following command:
docker run --platform linux/amd64 -d --name grafana --network migratorydata-network \
-p 3000:3000 grafana/grafana
Note that we export the port 3000 outside of the Docker network to be able to access Grafana. So, assuming that you executed the command above on your desktop, you can access Grafana by opening in your web browser the following URL:
Otherwise, if you executed the command above on a remote machine, replace localhost in the URL above with the host name or IP address of your remote machine (and make sure the port 3000 is not blocked by the firewall).
Use the credentials admin as username and admin as password to login to Grafana.
Create a Prometheus data source
Once you logged in into Grafana, go to Configuration (the cogwheel icon) in the Grafana menu, and select Data Sources. Click on the button Add data source and select Prometheus. In the section HTTP, edit the parameter URL and configure it with the following value:
http://prometheus.migratorydata-network:9090
Finally, click on the button Save & Test in the bottom.
Remember that both Grafana and Prometheus are deployed on the same Docker network migratorydata-network, therefore Grafana will be able to gather the data from Prometheus using the network address prometheus.migratorydata-network and the port 9090, which is the default port used by Prometheus to accept client connections.
Load the dashboard template
We’ve made available a dashboard template which you can use as a good starting point to customize your own monitoring dashboard for your MigratoryData clusters. To load this template, go to Create (the plus icon) in the Grafana menu, and select Import. Finally, enter the id 14004 in the section Import from grafana.com and click the button Load on the right. Select Prometheusa as data source, and finally click on the button Import.
14004 is also available for download at https://grafana.com/grafana/dashboards/14004. So, you can download it as a json file and load it to your Grafana deployment using the other available methods: import via panel json or upload json file.
Demo
Now, we can push some data to the deployment above and visualize the various metrics in the Grafana dashboard. To push data to your deployment, download the sources of the live demo from github:
https://github.com/migratorydata/migratorydata-demo-stocks
This project has two components, a backend component which is the market data generator, and a frontend component which is the realtime portfolio-like web app.
Backend
To build the market data generator, change to the folder backend of the project and execute the following command:
./gradlew clean build
Assuming you installed the MigratoryData server as a Docker container on your desktop, execute one of the following commands to start the market data generator:
./gradlew run --args="localhost 8800 some-token false \
'/AWERQ,/WERZF,/QWZAF,/TEYDF,/TYUII,/XCVSD,/POUVB,/TYEWD,/WYWUI'"

java -jar ./build/libs/backend.jar localhost 8800 some-token false \
'/AWERQ,/WERZF,/QWZAF,/TEYDF,/TYUII,/XCVSD,/POUVB,/TYEWD,/WYWUI'
Otherwise, if you installed the MigratoryData server as a Docker container on a remote machine, replace localhost in the command above with the host name or the IP address of that remote machine (and make sure that the port 8800 is not blocked by the firewall).
Frontend
To load the relatime web app, change to the folder frontend of the project, and run the following commands to install a local web server which will serve the sources of the relatime web app (alternatively you can install the sources of the realtime web app directly to a running web server):
npm install
npm run start
This will open a local server normally at the following address:
Assuming you installed the MigratoryData server as a Docker container on your desktop, you can already open this URL in your web browser to load the realtime web app. Otherwise, if you installed the MigratoryData server as a Docker container on a remote machine, before opening this URL, edit the file frontend/src/app/config.js and replace localhost from the variable SERVERS with the host name or the IP address of that remote machine.
Monitoring
Now, you can go to your Grafana installation and click on the dashboard template that you loaded previously to monitor the metrics of your deployment.
Maintenance
To check the status of your demo containers, stop and finally remove them, use the following commands:
docker ps
docker stop migratorydata prometheus grafana
docker rm migratorydata prometheus grafana
After removing the demo containers, you can remove the demo network that you created as follows:
docker network rm migratorydata-network
Conclusion
In this article, we’ve learned how to monitor MigratoryData with Prometheus and Grafana and used a live demo to exemplify this.
We’ve used the essential features of Prometheus and Grafana. These tools have many other interesting features that might be of interest for you. For example, you might want to configure Prometheus or Grafana to be notified when some metrics reaches a certain value. However, these are features specific to Prometheus and Grafana and therefore are out of scope of this article and our services.