
Massive scalability is the biggest challenge we undertake at MigratoryData, a provider of an enterprise publish-subscribe messaging system for building very scalable real-time web and mobile applications. We recently published a blog post demonstrating 12 million concurrent connections with MigratoryData WebSocket Server running on a single 1U server. I am going to share some lessons learned while pushing the boundaries of scalability with MigratoryData WebSocket Server.
Objective
The goal of our benchmark is to demonstrate the vertical scalability of the MigratoryData server using commodity hardware usually found in data centers. The server used for the benchmark was a Dell PowerEdge R610 (see the specs in the initial blog post) running CentOS 6.4 out of the box — with no Linux kernel recompilation.
Opening 12 Million Sockets
Let’s discuss the server side and the client side separately.
Server-Side Considerations
Server Port Numbers
A common misunderstanding is that a server cannot accept more than 65,536 (216) TCP sockets because TCP ports are 16-bit integer numbers.
First, the number of ports is limited to 65,536, but this limitation applies only to a single IP address. Supposing that we are limited by the number of ports to have more than 65,536 clients, then adding more IP addresses to the server machine (either by adding new network cards, or simply by using IP aliasing for the existing network card) would solve the problem (even if, for opening 12 million client would need 184 network cards or IP aliases on the server machine).
In fact, the misunderstanding comes from the fact that the server does not use its listening IP address and a different ephemeral port for each new socket to distinguish among the sockets, but it uses the same listening IP address and the same listening port for all sockets and it distinguishes among sockets by using the IP address and the ephemeral port of each client. Therefore, MigratoryData Server uses a single port to accept any number of clients and optionally it uses another few ports for JMX monitoring, HTTP monitoring, etc
Server Socket Descriptors
While the MigratoryData server uses a single port to accept any number of clients, it uses a different socket descriptor for each client. So, to open 12 million sockets, the process of the MigratoryData server should be able to use 12 million socket descriptors. Increasing the maximum number of socket descriptors per process is possible using the command ulimit. Consequently, we increased this limit to about 20 million socket descriptors as follows:
ulimit -n 20000500
Because one cannot increase the maximum number of socket descriptors per process to a value larger than the current kernel maximum (fs.nr_open) and because the kernel maximum defaults to 1048576 (10242), prior to running the ulimit command, we increased the kernel maximum accordingly as follows:
echo 20000500 > /proc/sys/fs/nr_open
Client-Side Considerations
We developed a tool named MigratoryData Client Benchmark able to open a configurable number of connections to the MigratoryData server. MigratoryData Client Benchmark is also able to subscribe to a configurable number of subjects for each client connection (where each subject is randomly selected from a configurable set of subjects) and compute various statistics for the received messages.
We used ten servers Dell PowerEdge SC1435 having 16 GB RAM and 2 dual-core AMD Opteron CPU @2.0 GHz to run ten instances of MigratoryData Client Benchmark. Hence, from each client machine we opened 1.2 million sockets.
Client Port Numbers
Each socket connection uses a new ephemeral port number on the client machine. Therefore, we extended the range of the ephemeral ports from 500 to the maximum theoretical limit 65,536 – keeping only the ports from 1 to 500 reserved for the operating system:
sysctl -w net.ipv4.ip_local_port_range="500 65535"
Using this extension of the ephemeral port range, one can open up to 65,035 sockets from a client machine per each IP address of the client machine.
In order to be able to open 1.2 million sockets from a client machine, we had to create 19 IP aliases for the network interface of the client machine. In this way, about 65,000 sockets are opened to the MigratoryData server from each of the 19 IP addresses.
19 IP addresses and a successive port starting with the port 500 and ending with the port 65535, thus avoiding the random allocation of the ephemeral port numbers.
Client Socket Descriptors
Each socket connection uses a socket descriptor on the client machine. Thus, to open 1.2 million sockets from a client machine, MigratoryData Client Benchmark should be able to use 1.2 million socket descriptors. As discussed in the section “Server Socket Descriptors” above, on each client machine we had to increase the maximum number of socket descriptors per process as follows:
echo 3000000 > /proc/sys/fs/nr_open
ulimit -n 2000000
Other Client Tuning Tips
To avoid delays between successive benchmark test rounds, we configured the kernel to reuse the sockets in state TIME_WAIT as follows:
echo 1 > /proc/sys/net/ipv4/tcp_tw_recycle
Another problem difficult to debug was when the kernel maximum number of memory pages allocated to the TCP was reached. When, this happened the MigratoryData Client Benchmark remained up, but the client machine did not accept any new TCP connection. We figured out that we have to increase the maximum number of memory pages allocated to the TCP from 767586 (about 3 GB) to 2303190 (about 8.7 GB) as follows:
sysctl -w net.ipv4.tcp_mem="383865 511820 2303190"
Linux Kernel Tuning
A number of kernel tuning suggestions, mainly in terms of ports and socket descriptors, were already provided above. Now, we focus on kernel tuning suggestions for memory and performance optimization.
Kernel Memory Tuning
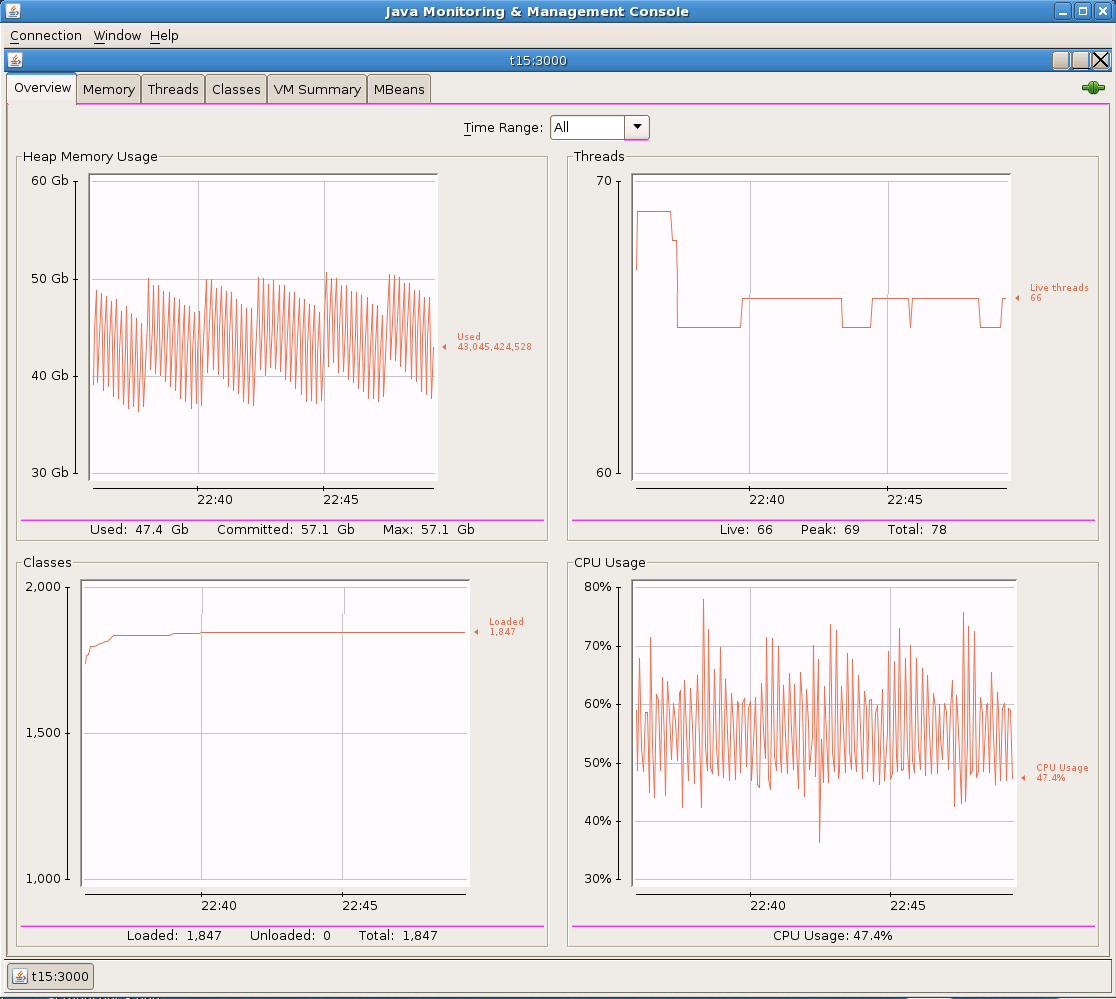
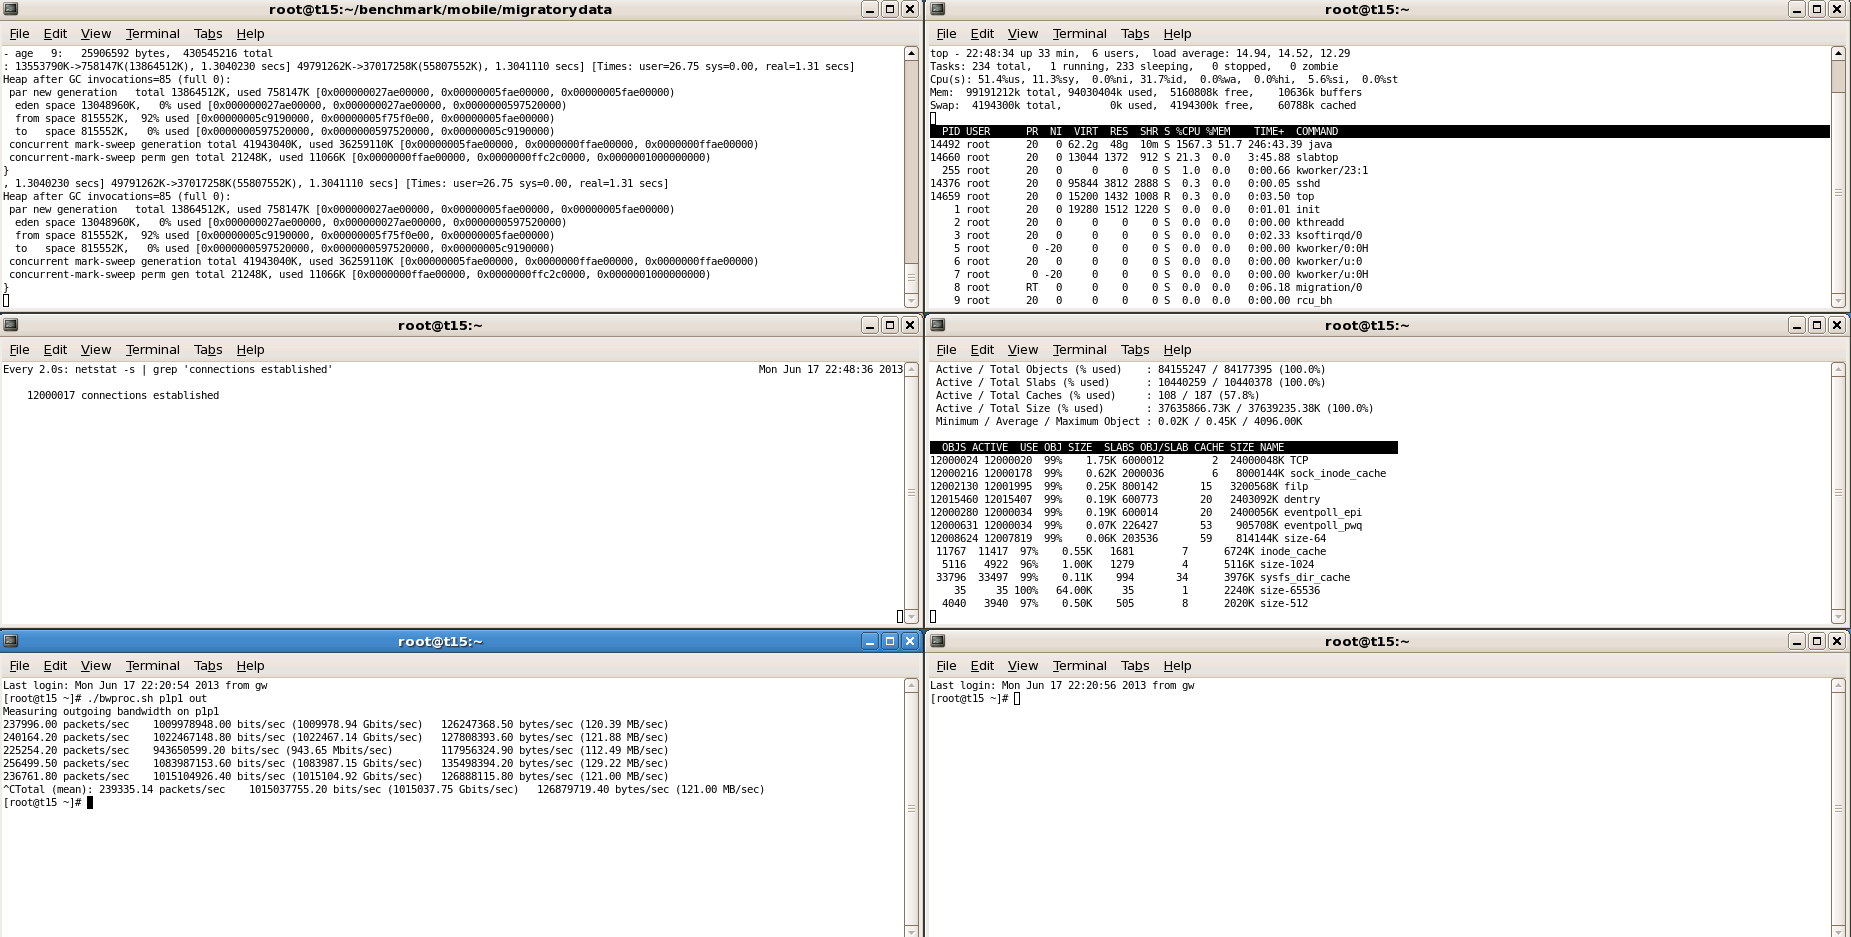
We used the Linux kernel version 3.9.4-1.el6.elrepo.x86_64 which consumed about 36 GB of kernel memory for the 12 million open sockets as shown by slabtop in one of the screenshots below.
/proc/meminfo which usually is not a big deal, but having lots of sockets one can observe a lot of memory vanishing in an inexplicable way. Therefore, a recent Linux kernel such as 3.9 optimizes the kernel memory with about 46 GB for 12 million sockets.
We used the following tuning related to the socket buffer sizes for our benchmark scenario:
sysctl -w net.ipv4.tcp_rmem="1024   4096   16384"
sysctl -w net.ipv4.tcp_wmem="1024   4096   16384"
sysctl -w net.ipv4.tcp_moderate_rcvbuf="0"
Balancing Hardware Interrupts
The server machine used a 10 Gbps network card Intel X520-DA2 having 24 tx/rx queues. We assigned each tx/rx queue to a different CPU core using smp_affinity. First, we identified the interrupts of our network interface named p1p1 as follows:
[root@t15 migratorydata]# grep p1p1 /proc/interrupts
77: 1684 0 0 0 0 0 0 0 0 0 0 0 0 0 0 0 0 0 0 0 0 0 0 0 PCI-MSI-edge  p1p1-TxRx-0
78: 1072 0 0 0 0 0 0 0 0 0 0 0 0 0 0 0 0 0 0 0 0 0 0 0 PCI-MSI-edge  p1p1-TxRx-1
79: 1089 0 0 0 0 0 0 0 0 0 0 0 0 0 0 0 0 0 0 0 0 0 0 0 PCI-MSI-edge  p1p1-TxRx-2
80: 1072 0 0 0 0 0 0 0 0 0 0 0 0 0 0 0 0 0 0 0 0 0 0 0 PCI-MSI-edge  p1p1-TxRx-3
81: 1080 0 0 0 0 0 0 0 0 0 0 0 0 0 0 0 0 0 0 0 0 0 0 0 PCI-MSI-edge  p1p1-TxRx-4
82: 1076 0 0 0 0 0 0 0 0 0 0 0 0 0 0 0 0 0 0 0 0 0 0 0 PCI-MSI-edge  p1p1-TxRx-5
83: 1072 0 0 0 0 0 0 0 0 0 0 0 0 0 0 0 0 0 0 0 0 0 0 0 PCI-MSI-edge  p1p1-TxRx-6
84: 1072 0 0 0 0 0 0 0 0 0 0 0 0 0 0 0 0 0 0 0 0 0 0 0 PCI-MSI-edge  p1p1-TxRx-7
85: 1072 0 0 0 0 0 0 0 0 0 0 0 0 0 0 0 0 0 0 0 0 0 0 0 PCI-MSI-edge  p1p1-TxRx-8
86: 1072 0 0 0 0 0 0 0 0 0 0 0 0 0 0 0 0 0 0 0 0 0 0 0 PCI-MSI-edge  p1p1-TxRx-9
87: 1105 0 0 0 0 0 0 0 0 0 0 0 0 0 0 0 0 0 0 0 0 0 0 0 PCI-MSI-edge  p1p1-TxRx-10
88: 1072 0 0 0 0 0 0 0 0 0 0 0 0 0 0 0 0 0 0 0 0 0 0 0 PCI-MSI-edge  p1p1-TxRx-11
89: 1073 0 0 0 0 0 0 0 0 0 0 0 0 0 0 0 0 0 0 0 0 0 0 0 PCI-MSI-edge  p1p1-TxRx-12
90: 1072 0 0 0 0 0 0 0 0 0 0 0 0 0 0 0 0 0 0 0 0 0 0 0 PCI-MSI-edge  p1p1-TxRx-13
91: 1073 0 0 0 0 0 0 0 0 0 0 0 0 0 0 0 0 0 0 0 0 0 0 0 PCI-MSI-edge  p1p1-TxRx-14
92: 1073 0 0 0 0 0 0 0 0 0 0 0 0 0 0 0 0 0 0 0 0 0 0 0 PCI-MSI-edge  p1p1-TxRx-15
93: 1075 0 0 0 0 0 0 0 0 0 0 0 0 0 0 0 0 0 0 0 0 0 0 0 PCI-MSI-edge  p1p1-TxRx-16
94: 1072 0 0 0 0 0 0 0 0 0 0 0 0 0 0 0 0 0 0 0 0 0 0 0 PCI-MSI-edge  p1p1-TxRx-17
95: 1072 0 0 0 0 0 0 0 0 0 0 0 0 0 0 0 0 0 0 0 0 0 0 0 PCI-MSI-edge  p1p1-TxRx-18
96: 1072 0 0 0 0 0 0 0 0 0 0 0 0 0 0 0 0 0 0 0 0 0 0 0 PCI-MSI-edge  p1p1-TxRx-19
97: 1072 0 0 0 0 0 0 0 0 0 0 0 0 0 0 0 0 0 0 0 0 0 0 0 PCI-MSI-edge  p1p1-TxRx-20
98: 1072 0 0 0 0 0 0 0 0 0 0 0 0 0 0 0 0 0 0 0 0 0 0 0 PCI-MSI-edge  p1p1-TxRx-21
99: 1072 0 0 0 0 0 0 0 0 0 0 0 0 0 0 0 0 0 0 0 0 0 0 0 PCI-MSI-edge  p1p1-TxRx-22
100: 1072 0 0 0 0 0 0 0 0 0 0 0 0 0 0 0 0 0 0 0 0 0 0 0 PCI-MSI-edge  p1p1-TxRx-23
101:    2 0 0 0 0 0 0 0 0 0 0 0 0 0 0 0 0 0 0 0 0 0 0 0 PCI-MSI-edge  p1p1
By default, the interrupts are assigned to the first CPU core. To balance the hardware interrupts of each tx/rx queue to a different CPU core, we used:
[root@t15 ~]# cat smp_affinity.sh
echo "1" >/proc/irq/77/smp_affinity
echo "2" >/proc/irq/78/smp_affinity
echo "4" >/proc/irq/79/smp_affinity
echo "8" >/proc/irq/80/smp_affinity
echo "10" >/proc/irq/81/smp_affinity
echo "20" >/proc/irq/82/smp_affinity
echo "40" >/proc/irq/83/smp_affinity
echo "80" >/proc/irq/84/smp_affinity
echo "100" >/proc/irq/85/smp_affinity
echo "200" >/proc/irq/86/smp_affinity
echo "400" >/proc/irq/87/smp_affinity
echo "800" >/proc/irq/88/smp_affinity
echo "1000" >/proc/irq/89/smp_affinity
echo "2000" >/proc/irq/90/smp_affinity
echo "4000" >/proc/irq/91/smp_affinity
echo "8000" >/proc/irq/92/smp_affinity
echo "10000" >/proc/irq/93/smp_affinity
echo "20000" >/proc/irq/94/smp_affinity
echo "40000" >/proc/irq/95/smp_affinity
echo "80000" >/proc/irq/96/smp_affinity
echo "100000" >/proc/irq/97/smp_affinity
echo "200000" >/proc/irq/98/smp_affinity
echo "400000" >/proc/irq/99/smp_affinity
echo "800000" >/proc/irq/100/smp_affinity
After running this smp_affinity script, one can see that the interrupts are now balanced on all 24 CPU cores:
[root@t15 ~]# grep p1p1 /proc/interrupts
77:  3002 0 0 0 0 0 0 0 0 0 0 0 0 0 0 0 0 0 0 0 0 0 0 0 PCI-MSI-edge p1p1-TxRx-0
78:  1453 123 0 0 0 0 0 0 0 0 0 0 0 0 0 0 0 0 0 0 0 0 0 0 PCI-MSI-edge p1p1-TxRx-1
79:  1475 0 437 0 0 0 0 0 0 0 0 0 0 0 0 0 0 0 0 0 0 0 0 0 PCI-MSI-edge p1p1-TxRx-2
80:  1453 0 0 123 0 0 0 0 0 0 0 0 0 0 0 0 0 0 0 0 0 0 0 0 PCI-MSI-edge p1p1-TxRx-3
81:  1462 0 0 0 127 0 0 0 0 0 0 0 0 0 0 0 0 0 0 0 0 0 0 0 PCI-MSI-edge p1p1-TxRx-4
82:  1457 0 0 0 0 123 0 0 0 0 0 0 0 0 0 0 0 0 0 0 0 0 0 0 PCI-MSI-edge p1p1-TxRx-5
83:  1456 0 0 0 0 0 125 0 0 0 0 0 0 0 0 0 0 0 0 0 0 0 0 0 PCI-MSI-edge p1p1-TxRx-6
84:  1453 0 0 0 0 0 0 123 0 0 0 0 0 0 0 0 0 0 0 0 0 0 0 0 PCI-MSI-edge p1p1-TxRx-7
85:  1453 0 0 0 0 0 0 0 123 0 0 0 0 0 0 0 0 0 0 0 0 0 0 0 PCI-MSI-edge p1p1-TxRx-8
86:  1453 0 0 0 0 0 0 0 0 123 0 0 0 0 0 0 0 0 0 0 0 0 0 0 PCI-MSI-edge p1p1-TxRx-9
87:  1497 0 0 0 0 0 0 0 0 0 130 0 0 0 0 0 0 0 0 0 0 0 0 0 PCI-MSI-edge p1p1-TxRx-10
88:  1453 0 0 0 0 0 0 0 0 0 0 123 0 0 0 0 0 0 0 0 0 0 0 0 PCI-MSI-edge p1p1-TxRx-11
89:  1454 0 0 0 0 0 0 0 0 0 0 0 123 0 0 0 0 0 0 0 0 0 0 0 PCI-MSI-edge p1p1-TxRx-12
90:  1453 0 0 0 0 0 0 0 0 0 0 0 0 123 0 0 0 0 0 0 0 0 0 0 PCI-MSI-edge p1p1-TxRx-13
91:  1454 0 0 0 0 0 0 0 0 0 0 0 0 0 123 0 0 0 0 0 0 0 0 0 PCI-MSI-edge p1p1-TxRx-14
92:  1454 0 0 0 0 0 0 0 0 0 0 0 0 0 0 123 0 0 0 0 0 0 0 0 PCI-MSI-edge p1p1-TxRx-15
93:  1456 0 0 0 0 0 0 0 0 0 0 0 0 0 0 0 123 0 0 0 0 0 0 0 PCI-MSI-edge p1p1-TxRx-16
94:  1453 0 0 0 0 0 0 0 0 0 0 0 0 0 0 0 0 123 0 0 0 0 0 0 PCI-MSI-edge p1p1-TxRx-17
95:  1453 0 0 0 0 0 0 0 0 0 0 0 0 0 0 0 0 0 123 0 0 0 0 0 PCI-MSI-edge p1p1-TxRx-18
96:  1453 0 0 0 0 0 0 0 0 0 0 0 0 0 0 0 0 0 0 123 0 0 0 0 PCI-MSI-edge p1p1-TxRx-19
97:  1453 0 0 0 0 0 0 0 0 0 0 0 0 0 0 0 0 0 0 0 123 0 0 0 PCI-MSI-edge p1p1-TxRx-20
98:  1453 0 0 0 0 0 0 0 0 0 0 0 0 0 0 0 0 0 0 0 0 123 0 0 PCI-MSI-edge p1p1-TxRx-21
99:  1453 0 0 0 0 0 0 0 0 0 0 0 0 0 0 0 0 0 0 0 0 0 123 0 PCI-MSI-edge p1p1-TxRx-22
100: 1453 0 0 0 0 0 0 0 0 0 0 0 0 0 0 0 0 0 0 0 0 0 0 123 PCI-MSI-edge p1p1-TxRx-23
101:    2 0 0 0 0 0 0 0 0 0 0 0 0 0 0 0 0 0 0 0 0 0 0 0 PCI-MSI-edge p1p1
Benchmark Configuration
Please refer to the sections “Hardware and Setup” and “The Benchmark Scenario” in the initial blog post for precise details about the benchmark scenario and setup used by the involved components: MigratoryData Server, MigratoryData Client Benchmark, and MigratoryData Publisher Benchmark. Here we detail their configurations.
MigratoryData Server
We used the following configuration of the MigratoryData server:
Memory = 55296 MB # Allocate 54 GB to the JVM
Listen = *:8800 # Accept clients on port 8800
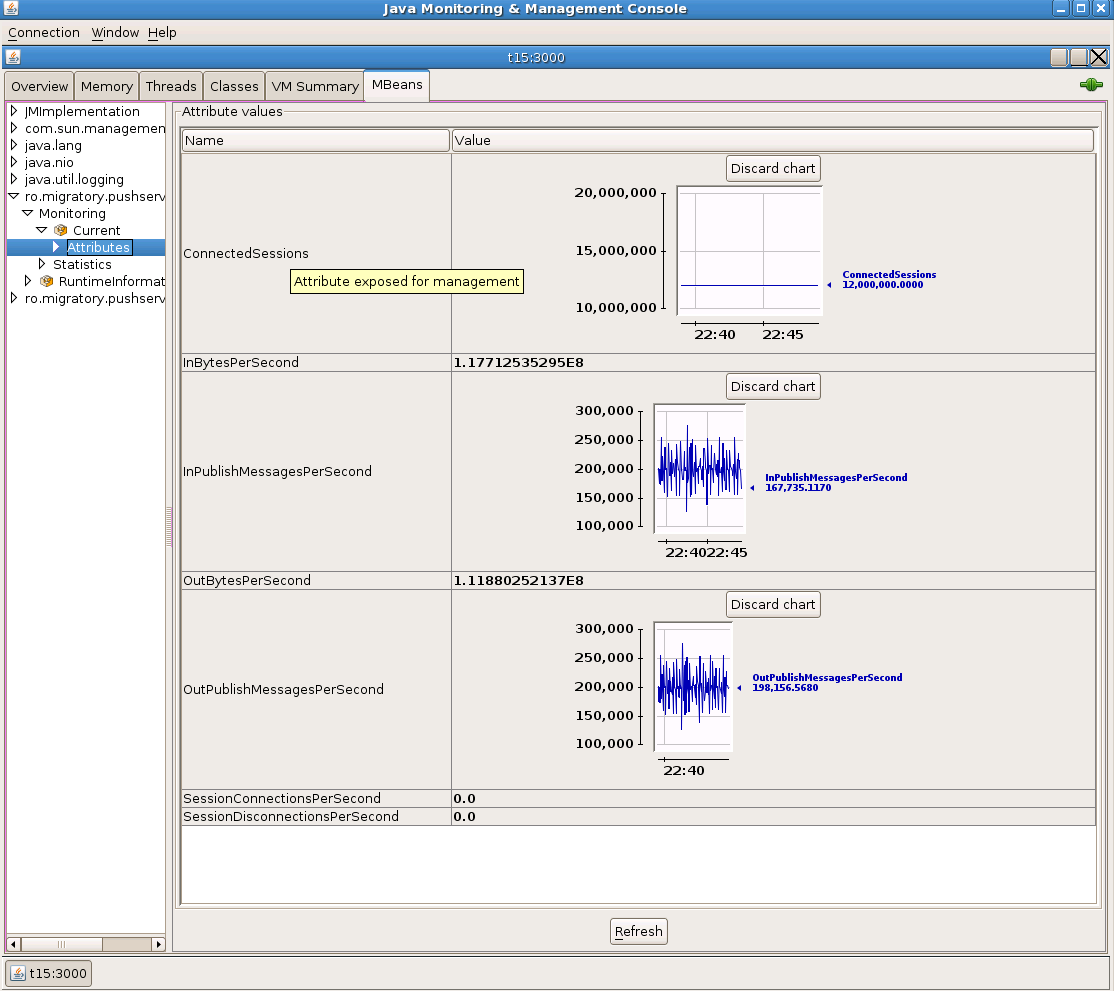
Monitor = JMX # Enabled JMX monitoring
MonitorJMX.Listen = 192.168.3.115:3000
MonitorJMX.Authentication = false
BufferLimit.Send = 800 # Set the initial buffer sizes to 800 bytes given
BufferLimit.Receive = 800 # that we publish messages of 512 bytes
PubSubTightlyCoupled = false # Disable subscribe notifications to publishers
CacheSize = 0 # Disable the cache
BenchmarkMode = true # See details below
The parameter BenchmarkMode is set on true to handle the clients in a realistic way. In fact, in order to take advantage of multiprocessor servers, the incoming users are separated in parallel internal groups. Each client is assigned to a group based on its IP address. Because, in our benchmark a lot of clients come from the same IP address, we use the parameter BenchmarkMode to distribute them to different internal groups of the MigratoryData server, just as it would happen in production.
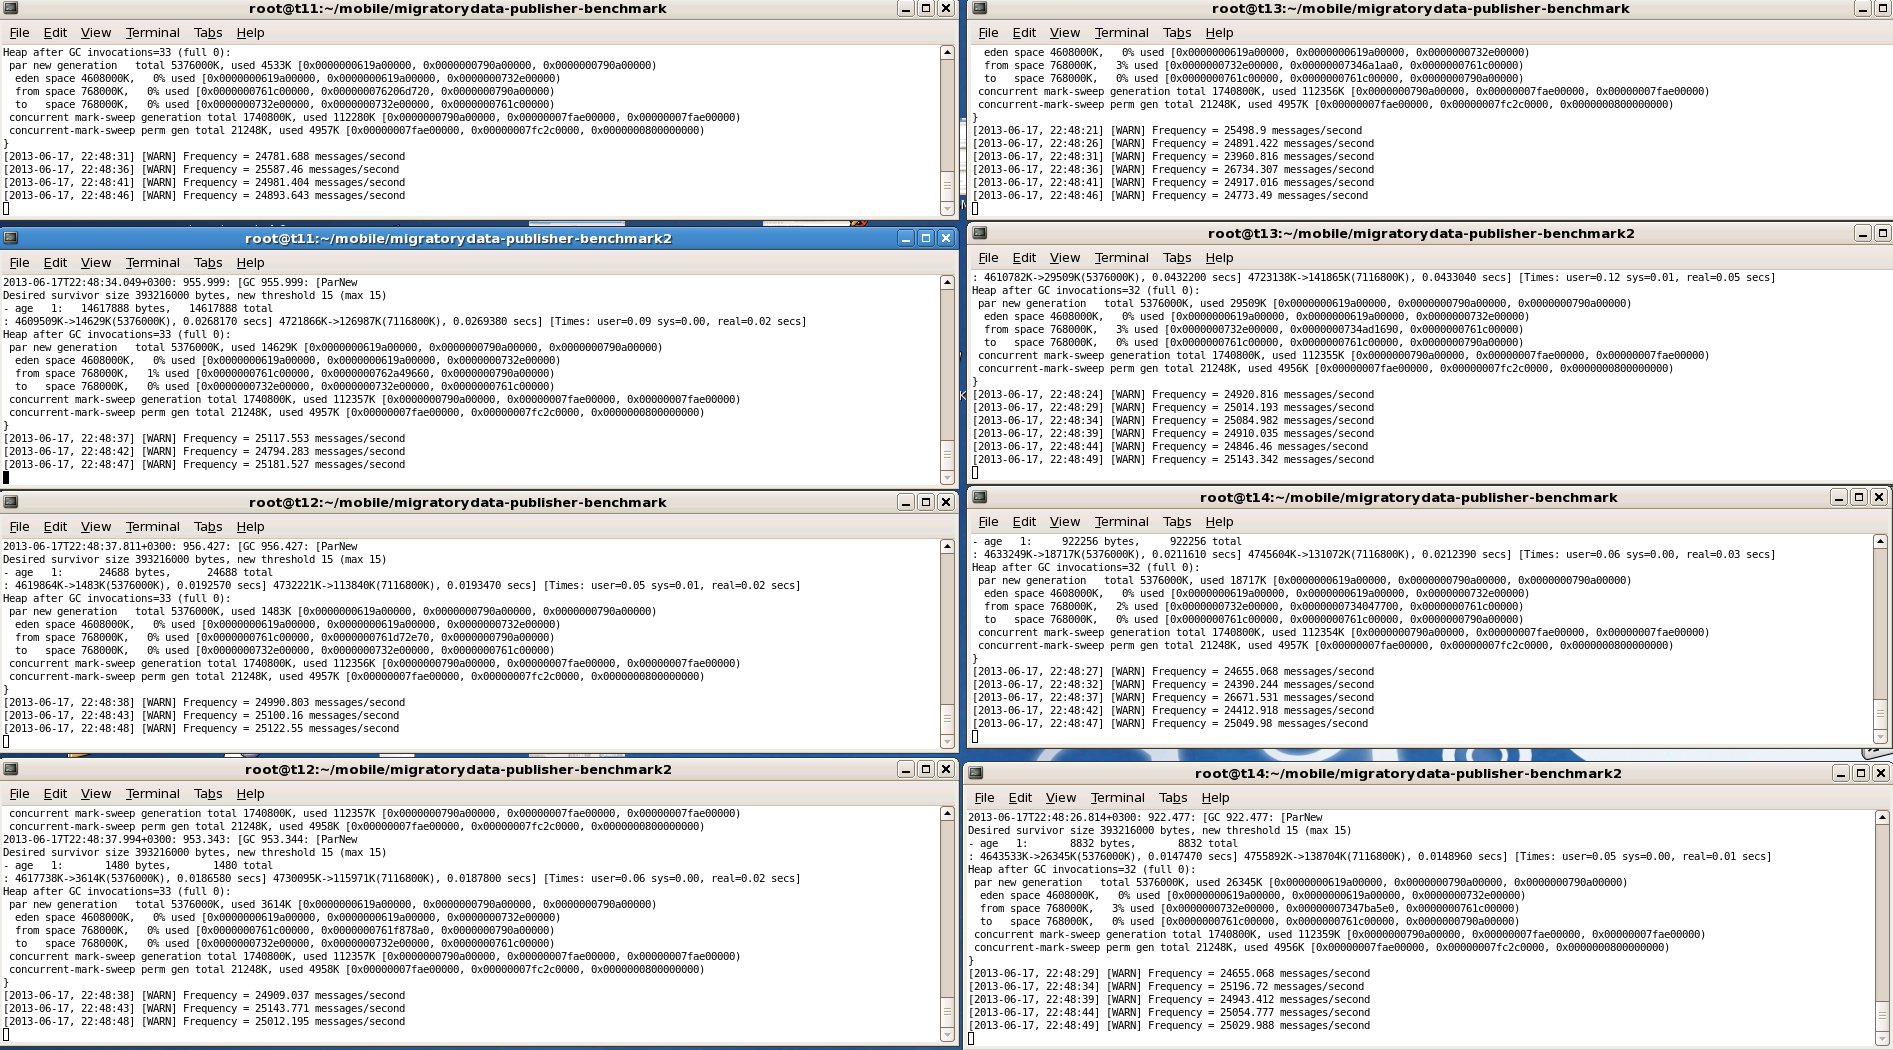
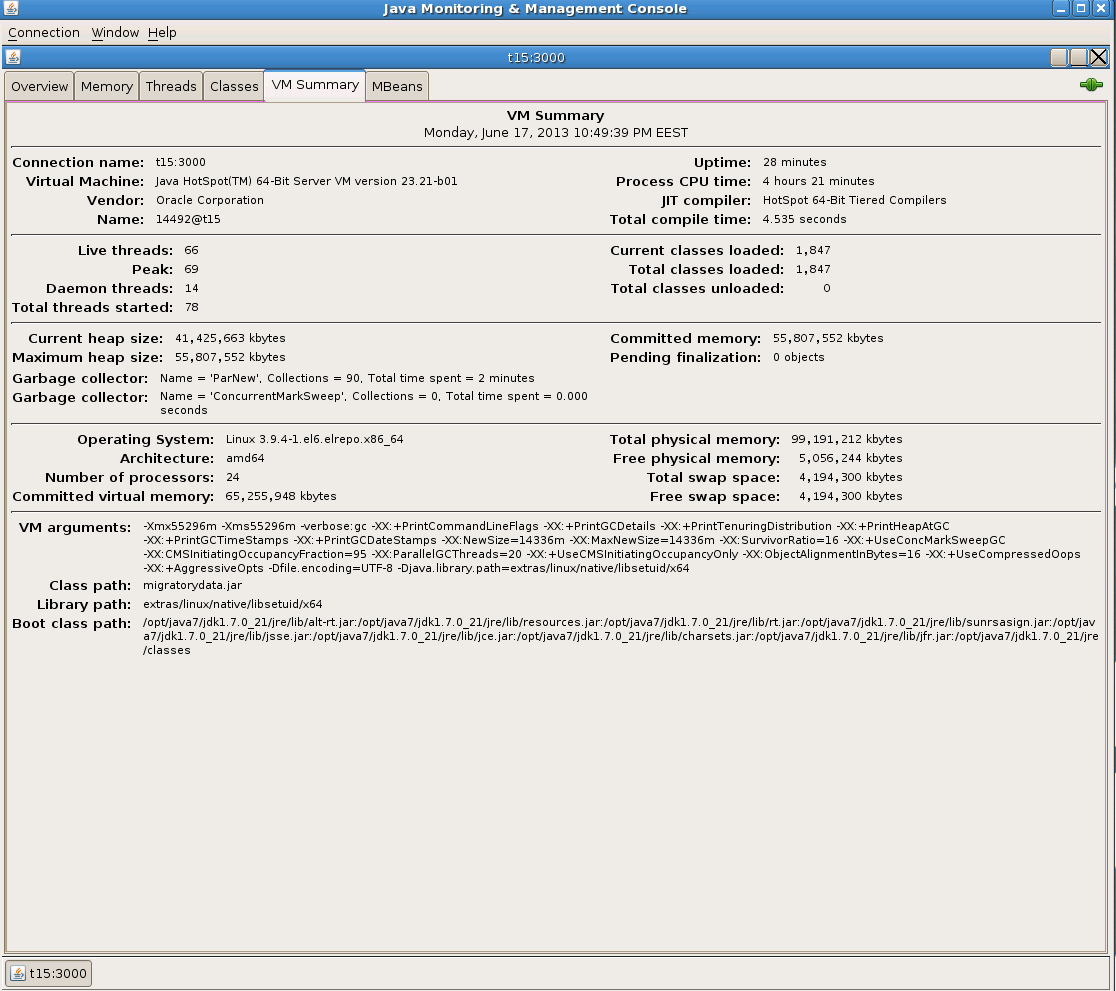
JVM Tuning
Tuning the JVM and especially the Garbage Collector related parameters is outside the scope of this blog post. We recommend the book Java Performance on JVM tuning. In a screenshot below we provide all the JVM parameters used in the benchmark.
The JVM parameter UseCompressedOops compresses the 64-bit pointers and offers non-negligible memory optimization. The recent versions of JVM enable this parameter by default for the JVM heap sizes smaller than about 30 GB. But UseCompressedOops can be used only for a JVM heap size of maximum 32 GB. The JVM parameter ObjectAlignmentInBytes extends the compression to the JVM heap sizes larger than 32 GB. Using the parameters ObjectAlignmentInBytes and UseCompressedOops allowed us to benefit from pointer compression for the entire memory allocated to the MigratoryData server without the need to run two instances of the MigratoryData server each one using less than 32 GB. Therefore, we included the following JVM parameters:
-XX:ObjectAlignmentInBytes=16 -XX:+UseCompressedOops
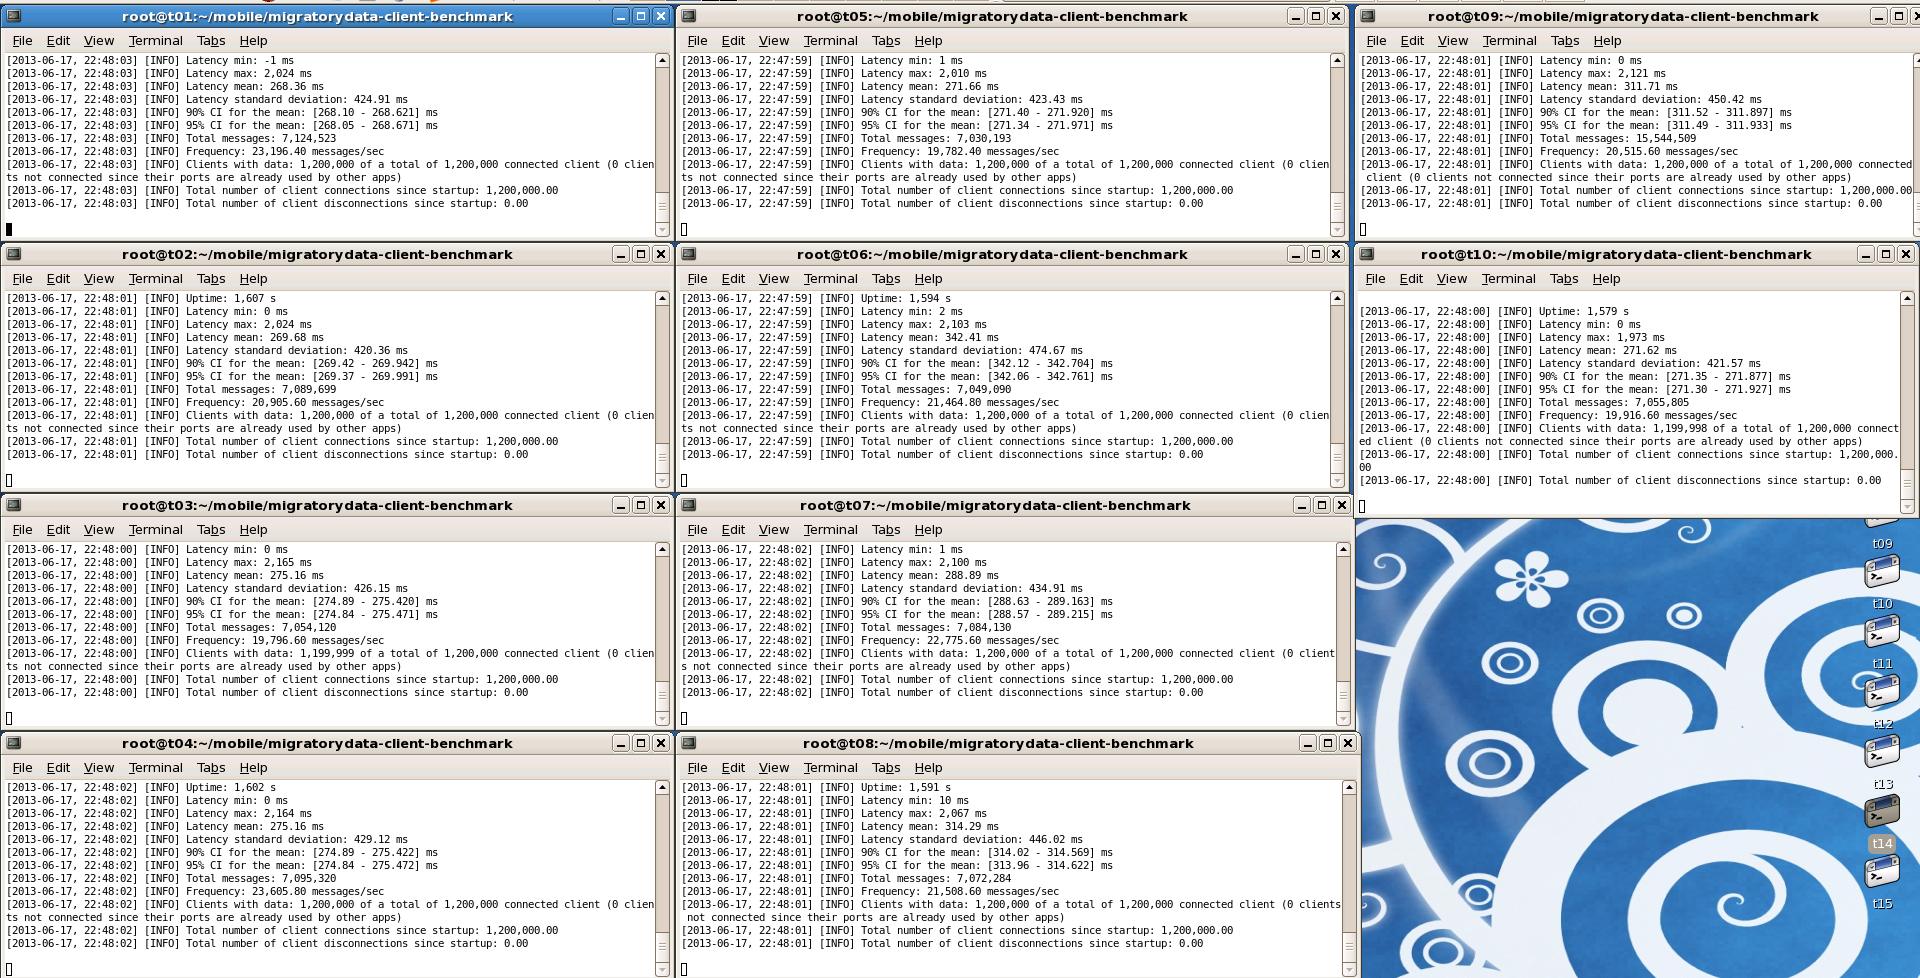
MigratoryData Client Benchmark
We used 10 instances of MigratoryData Client Benchmark running on 10 client machines Dell SC1435 as described above. Each instance of MigratoryData Client Benchmark opened 1.2 million connections to the MigratoryData server. Along each connection MigratoryData Client Benchmark subscribed to a different subject. Hence, we had 12 million concurrent clients subscribing to 12 million concurrent subjects.
For example, the 1st of the 10 instances of MigratoryData Client Benchmark used the following configuration:
Memory = 9000                         # Allocate 8.7 GB to the JVM
ServerAddresses = 192.168.3.115:8800  # The address of the MigratoryData server
Clients = 1200000                     # Open 1.2 million subjects
Subjects = /p/s{1..1200000}/-         # Subscribe to /p/s1/-, /p/s2/-, ..., /p/s1200000/-
SubjectsPerClient = 1                 # Each client subscribes to one subject
LocalAddresses = 192.168.{10..30}.101 # Use these IP addresses for client sockets
BufferSize = 1024                     # Set the initial buffer size to 1024 bytes
OneToOne = true                       # client 1 subscribes to /p/s1,
                                        # client 2 subscribes to /p/s2,
                                        # ...
                                        # client 1200000 subscribes to /p/s1200000
In the same way:
- The 2nd instance of the MigratoryData Client Benchmark has been configured to open another 1.2 million concurrent connections and subscribed to the subjects from
/p/s1200001/-to/p/s2400000/- - The 3rd instance of the MigratoryData Client Benchmark has been configured to open another 1.2 million concurrent connections and subscribed to the subjects from
/p/s2400001/-to/p/s4800000/- - …
- The 10th instance of the MigratoryData Client Benchmark has been configured to open another 1.2 million concurrent connections and subscribed to the subjects from
/p/s10800001/-to/p/s12000000/-
Each instance of MigratoryData Client Benchmark displays every 5 seconds various information such as: the number of seconds since the start time, the minimum, maximum, mean, standard deviation for all messages received, the total number of messages received, and the frequency of the messages received during the last 5 seconds, as in the example below:
[2013-06-18, 15:03:11] [INFO] Uptime: 1,607 s
[2013-06-18, 15:03:11] [INFO] Latency min: 0 ms
[2013-06-18, 15:03:11] [INFO] Latency max: 2,024 ms
[2013-06-18, 15:03:11] [INFO] Latency mean: 269.68 ms
[2013-06-18, 15:03:11] [INFO] Latency standard deviation: 420.36 ms
[2013-06-18, 15:03:11] [INFO] 90% CI for the mean: [269.42 - 269.942] ms
[2013-06-18, 15:03:11] [INFO] 95% CI for the mean: [269.37 - 269.991] ms
[2013-06-18, 15:03:11] [INFO] Total messages: 7,089,699
[2013-06-18, 15:03:11] [INFO] Frequency: 20,905.80 messages/sec
The latency statistics are detailed in the section “Latency” below.
MigratoryData Publisher Benchmark
In our benchmark scenario, there are 200,000 messages per second published to the MigratoryData server. The payload of each message is a 512-byte string of random characters. We have developed a tool named MigratoryData Publisher Benchmark which is able to publish messages of a configurable size at a configurable frequency, for subjects selected randomly from a configurable set of subjects.
We ran 8 instances of MigratoryData Publisher Benchmark on 4 machines Dell SC1435 having the same specs as the client machines, two instances per machine. To achieve 200,000 messages per second, each instance published 25,000 messages per second.
For example, the 1st of the 8 instances of MigratoryData Publisher Benchmark used the following configuration:
Memory = 7700                         # Allocate 7.5 GB to the JVM
ServerAddresses = 192.168.3.115:8800  # The address of the MigratoryData server
PublisherType = p                     # The first prefix of the subjects
Subjects = /s{1..1500000}/-           # Publish messages for /p/s1/-, /p/s2/-, ..., p/s1500000
Frequency = 25000                     # Number of messages per second
MessageSize = 512                     # The number of bytes per message
In the same way:
- The 2nd instance of the MigratoryData Publisher Benchmark has been configured to publish 25,000 messages per second where the subject of each message is randomly selected from the subjects between
/p/s1500001/-to/p/s3000000/- - The 3rd instance of the MigratoryData Publisher Benchmark has been configured to publish 25,000 messages per second where the subject of each message is randomly selected from the subjects between
/p/s3000001/-to/p/s4500000/- - …
- The 8th instance of the MigratoryData Publisher Benchmark has been configured to publish 25,000 messages per second where the subject of each message is randomly selected from the subjects between
/p/s10500000/-to/p/s12000000/-
Latency
Latency is defined here as the time needed for a message to propagate from the publisher to the client, via the MigratoryData server. In other words, the latency of a message is the difference between the time at which the message is sent by MigratoryData Publisher Benchmark to the MigratoryData server and the time at which the message is received by MigratoryData Client Benchmark from the MigratoryData server. All the client machines and publisher machines have the clocks synchronized using ntp (a few milliseconds difference might exist between the clocks, so you can observe a minimum latency of -1 millisecond due to such small clock differences).
We calculate the following latency statistics: maximum, mean, and standard deviation.
In order to calculate the latency statistics, one can use all latency values or use a reasonable sample size. The sampling approach provides statistically accurate results but it should be typically used when it is not possible to obtain all the values (e.g. election polling). Another disadvantage is that sampling cannot be used to compute the absolute maximum latency.
Because for certain systems, having a predictable latency – under a certain maximum – is more valuable than having low latency values in average, we chosen to calculate the latency statistics for all values, and so also obtaining the true maximum latency. While it might appear that computing the latency statistics for all values would add a certain performance overhead, in fact, one needs not to store the latency values, because the statistics can be calculated on-the-fly for all messages as follows:
numberOfMessages++;
maxLatency = maximum{maxLatency, newLatency}; /* max  */
deltaLatency = newLatency - meanLatency;
meanLatency = meanLatency + (deltaLatency / numberOfMessages); /* mean */
sumOfSquaredDelta += deltaLatency * (newLatency - meanLatency);
stdevLatency = sqrt(sumOfSquaredDelta / numberOfMessages); /* stdev */
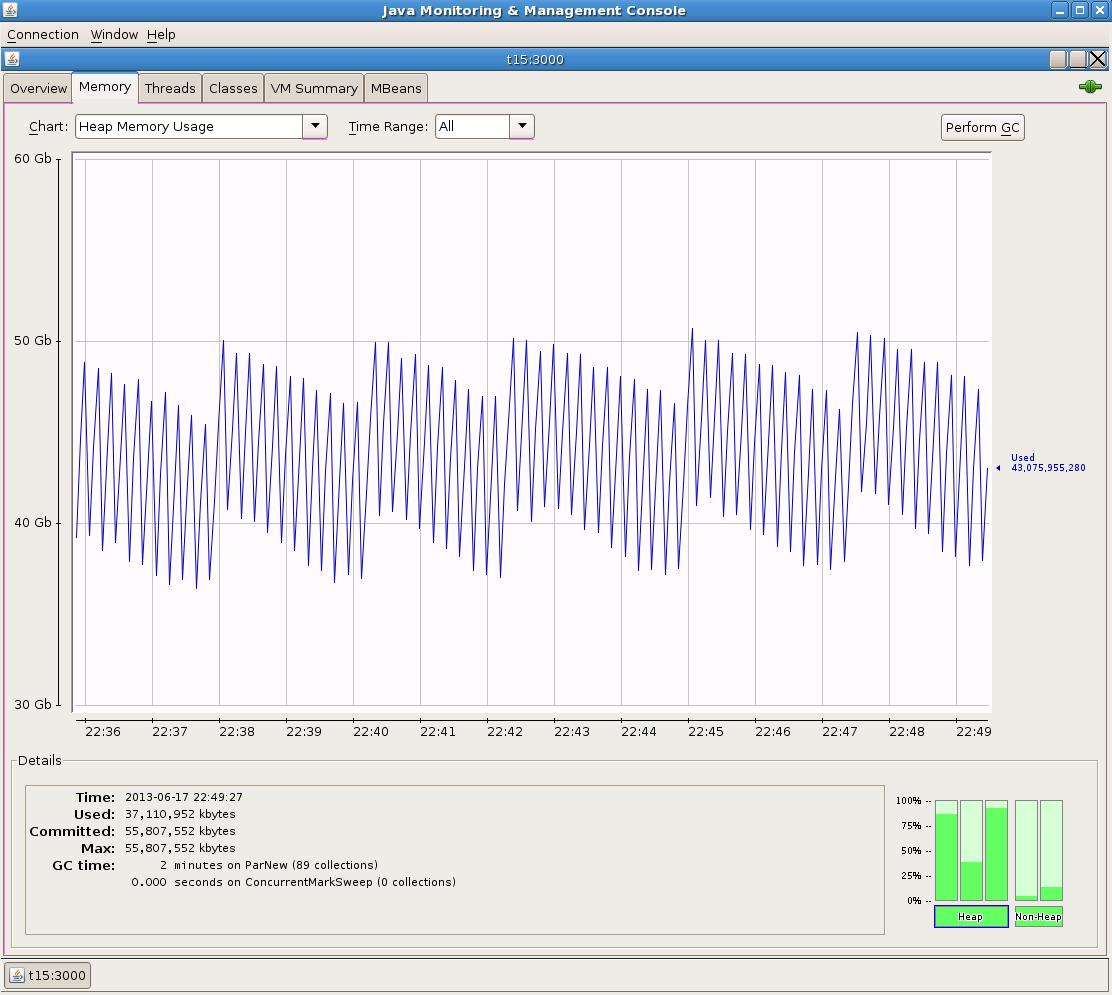
Bandwidth
The Linux tools available for bandwidth calculation usually attempt to compute the bandwidth by capturing TCP packets. This approach does not scale for high data throughput and the bandwidth values produced are usually not accurate.
An accurate method for bandwidth calculation is to use the Receive Bytes / Packets and Transmit Bytes / Packets written by the Linux kernel to /proc/net/dev for the network interface used by the MigratoryData server. We compute the bandwidth by reading /proc/net/dev every 10 seconds. You can see the bandwidth transmitted by the MigratoryData server in one of the screenshots below.
Results
These are the screenshots with the results obtained which have been detailed above.
Conclusion
In this post we presented the obstacles faced when scaling to 12 million concurrent connections in terms of kernel tuning, memory tuning, tools, and benchmarking methodology. More insights into how MigratoryData WebSocket Server itself is designed to achieve this massive vertical scalability might be the subject of a new post.