
The C10M problem relates to the classic C10K Internet scalability problem, which originally occurred in the context of Web servers. The C10K problem consists of successfully supporting 10,000 concurrent connections on a single machine. While the C10K problem is currently solved by certain Web servers, the C10M problem, which consists in supporting 10 million concurrent connections on a single machine, remains a challenging problem not only for Web servers, but for any Internet server in general.
MigratoryData Server is a real-time Web server using the WebSocket protocol, as well as the HTTP protocol, to communicate with its clients. Unlike traditional Web servers, MigratoryData Server does not use the request-response interaction model (employing short-living connections). Rather it uses the publish/subscribe model along persistent connections. With clients permanently connected, MigratoryData Server makes data delivery to its clients possible in a timely manner, with low latency.
In addition to its role as real-time Web server, MigratoryData Server implements features traditionally provided by Enterprise Messaging Systems such as publish/subscribe interaction, active/active clustering, guaranteed message delivery, entitlement, as well as API libraries for the most popular environments.
While achieving high scalability is a difficult task for a Web server in general, achieving high scalability for a real-time Web server, without sacrificing enterprise messaging features, is even harder.
In this article, we demonstrate that MigratoryData Server is able to handle 10 million concurrent connections on a single commodity machine. Moreover, it is able to push almost 1 Gbps live data to these 10 million users (each user receiving a 512-byte message per minute) with an average latency of under 100 milliseconds.
MigratoryData’s Publish/Subscribe Interaction
Subscribing clients connect to the MigratoryData server using persistent WebSocket or HTTP connections and subscribe to one or more subjects (also known as topics) by using MigratoryData’s protocol. Publishing clients communicate with the MigratoryData server in the same way as subscribing clients, but they publish messages. A message contains mainly a subject and some data. When a message is received by the MigratoryData server, it distributes that message to all clients that subscribed to the subject of that message.
Benchmark Setup
We used several publishing clients to push messages into a MigratoryData server, which pushed the messages out to several subscribing clients through HTTP persistent connections.
The publishing tool used in the benchmark test – MigratoryData Benchpub – is capable of publishing messages of a configurable size at a configurable frequency. The subscribing tool – MigratoryData Benchsub – is capable of opening a configurable number of concurrent connections, subscribing to a configurable number of subjects, and computing the latency of the messages received for the subscribed subjects. Both Benchpub and Benchsub use MigratoryData’s protocol, so they simulate real applications.
The following diagram shows the architecture of the benchmark test.
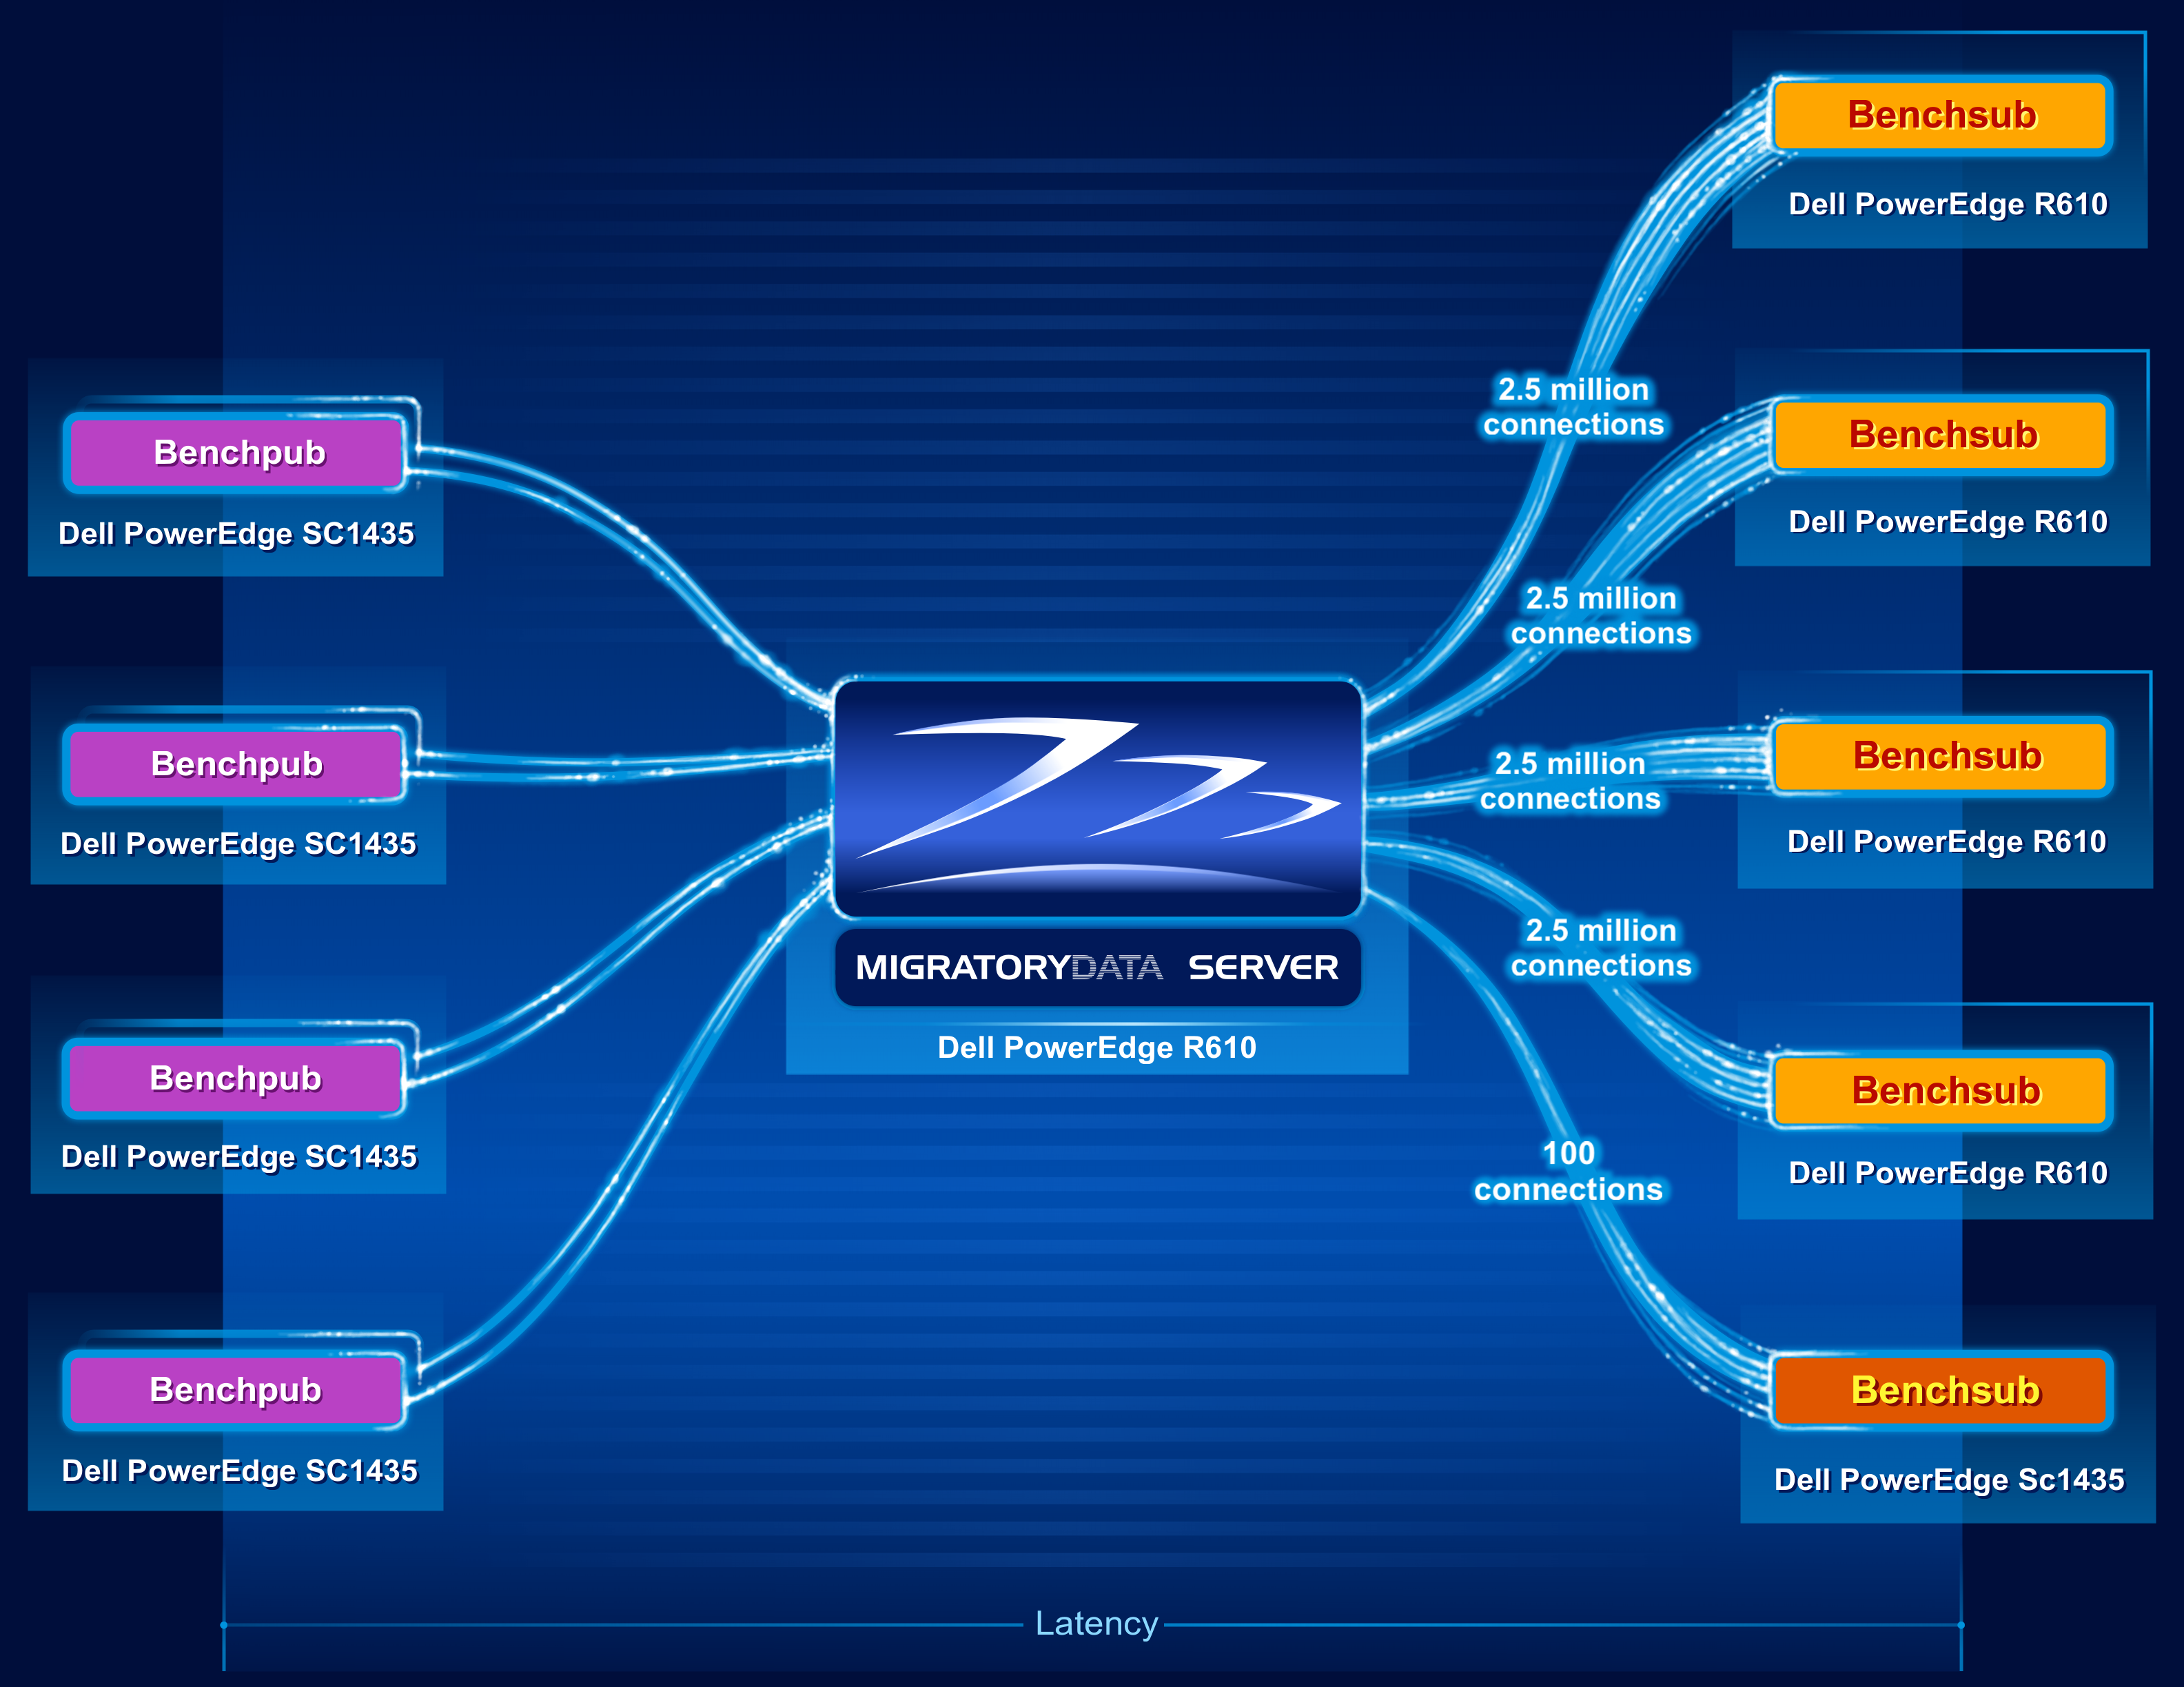
Nine machines were utilized in the benchmark test, as follows:
- One Dell R610 machine was utilized to run one instance of the MigratoryData server. The specifications of this 1U machine are as follows:
- 2 x Intel Xeon X5650 CPU at 2.66 GHz (6 cores per CPU, totaling 12 cores)
- 96 GB RAM (DDR3 at 1333 MHz)
- Network adapter Intel X520-DA2 (10 Gbps)
- CentOS / RHEL 7.1 with the default kernel 3.10.0-229 (without kernel recompilation)
- Four Dell R610 machines were utilized to run four instances of Benchsub. Each Benchsub instance simulated 2.5 million concurrent users each, totaling 10 million concurrent users. Each user subscribed to a distinct subject. Therefore, the total number of concurrent subjects was also 10 million.
- Four Dell SC1435 machines were utilized to run eight instances of Benchpub (four pairs of instances). Each of the eight Benchpub instances published at a frequency of 21,000 messages per second, with each message containing a sequence of 512 random bytes. The total message throughput was therefore 168,000 messages/second (i.e. 10,080,000 messages/minute). In this way, each user received one message per minute.
- Finally, an additional Benchsub instance was used to simulate 100 concurrent users, representing samples of the population of 10 million concurrent users. This Benchsub instance was used to compute supplemental latency statistics – in addition to the latency statistics computed by the other four Benchsub instances. These other four Benchsub instances used the latencies of all messages received by all 10 million users to compute their statistics, instead of sampling the data.
Latency, depicted in the diagram above, is defined from the time Benchpub creates a message until the Bechsub receives the message from the MigratoryData server.
Results
MigratoryData Server provides advanced monitoring via JMX and other protocols. We used the jconsole tool (included in the Java Development Kit) to monitor the MigratoryData server via JMX. In the results presented below we show screenshots obtained during JMX monitoring.
Connections
As depicted in the Benchmark Setup section above, the 10 million concurrent connections were opened by four instances of Benchsub that simulated 2.5 million concurrent users each. Each of the 10 million users subscribed to a distinct subject, hence there were 10 million concurrent subscribed subjects as well. In addition, a fifth instance of Benchsub opened another 100 concurrent connections.
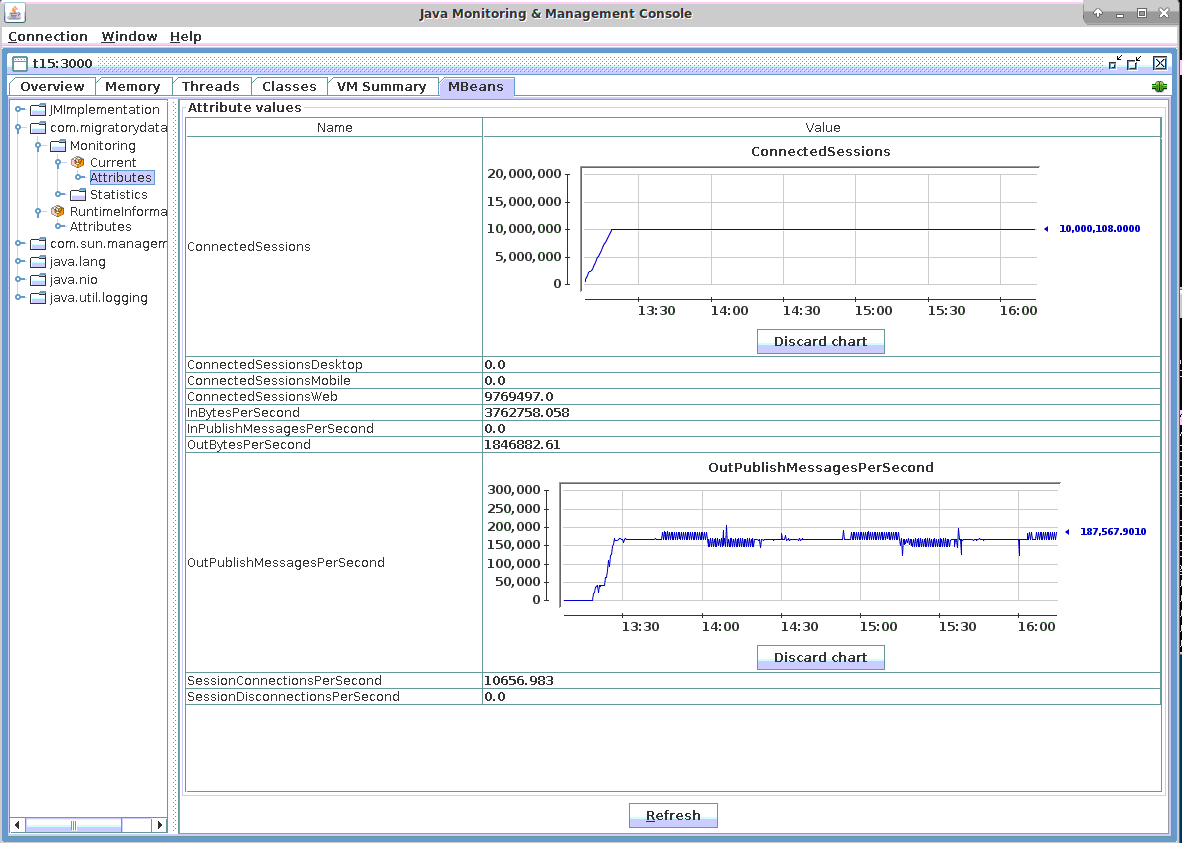
As can be seen from the JMX screenshot below, MigratoryData Server handled 10,000,108 concurrent connections (see the JMX indicator ConnectedSessions). The same number of concurrent socket connections is confirmed by the tools netstat and slabtop (see the screenshot in the Network Utilization subsection below).
Messages
As described in the Benchmark Setup section, eight Benchpub instances ran on four machines and sent messages to the MigratoryData server.
In order for each of the 10 million users to receive one message per minute, each of the eight Benchpub instances published 21,000 messages per second. The payload of each message consisted of a sequence of 512 random bytes. Therefore, the eight Benchpub instances sent 168,000 messages/second (i.e. 10,080,000 messages/minute) to the MigratoryData server which were then pushed out to the subscribing clients at the same message frequency.
The screenshot of the Connections subsection above shows that the outgoing messages throughput is around 168,000 messages per second (i.e. 10,080,000 messages/minute) (see the JMX indicator OutPublishMessagesPerSecond).
CPU Utilization
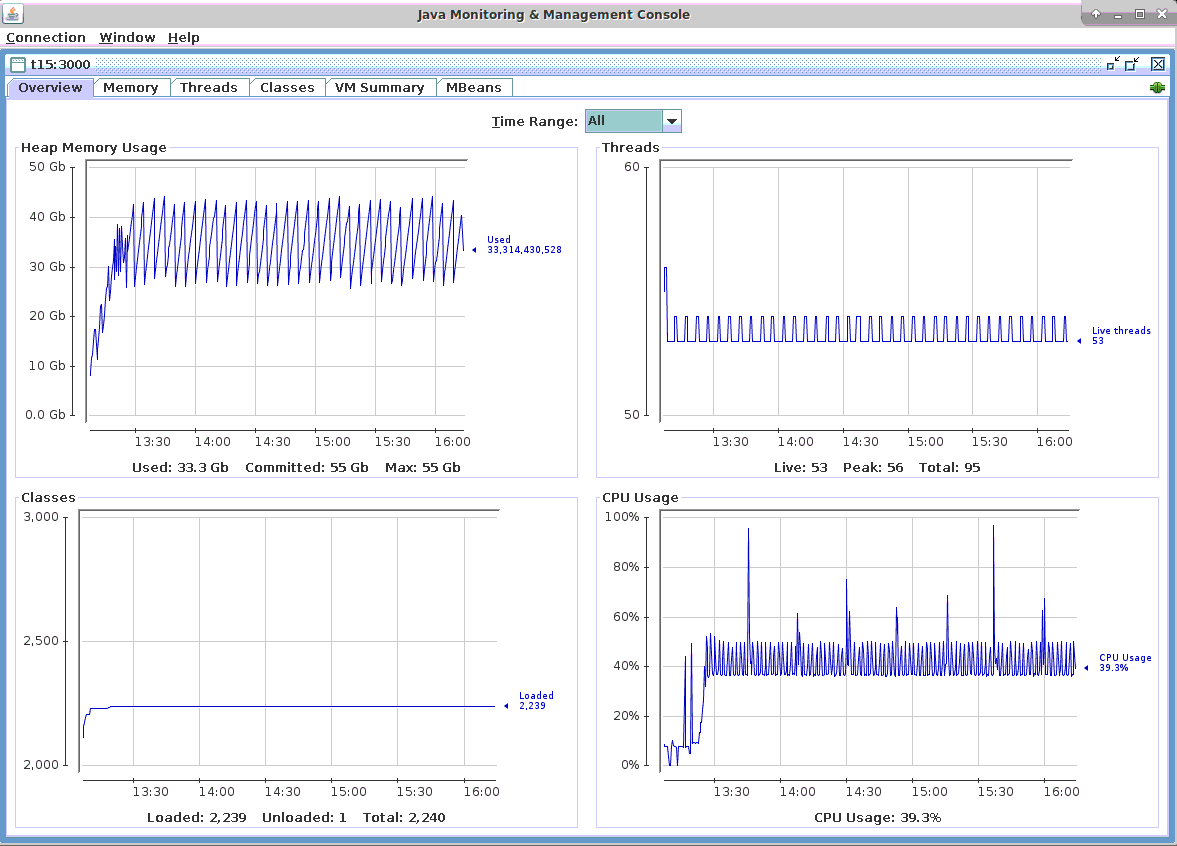
In the screenshot below, it can be seen that the CPU usage of the machine which hosted the MigratoryData server was under 50%, with spikes from time to time when a major JVM Garbage Collection occurred. In fact, from our observations, the CPU percent strictly utilized by the MigratoryData server is under 40%. The variations you can see in the screenshot from under 40% to about 50% occur when minor JVM Garbage Collections happen.
Memory Utilization
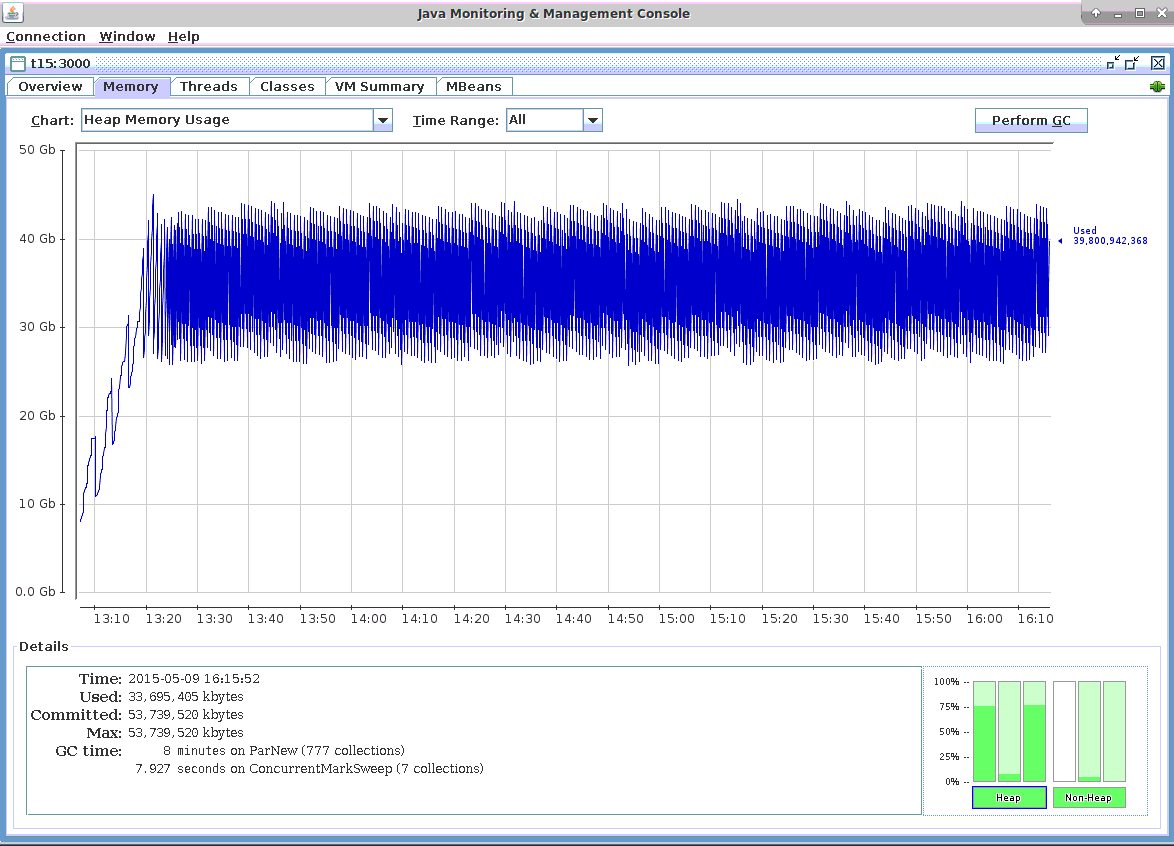
In the screenshot below you can see that the memory usage is predictable and the pattern does not change after 3 hours of test running. More importantly, during the 3 hours of test running there were both minor and major JVM Garbage Collections. Thus, the test simulates a real life situation when both types of Garbage Collections might occur.
Network Utilization
As you can see in the screenshot below, the outgoing traffic for pushing 168,000 messages/second (i.e. 10,080,000 messages/minute) to 10 million concurrent clients was 103 Megabytes per second, representing 0.8 Gbps.
The payload of each message is 512 bytes and the throughput is 168,000 messages/second (i.e. 10,080,000 messages/minute), totaling 82 Megabytes per second. The difference of 21 MB/sec, up to the actual bandwidth utilization of 103 MB/sec, was introduced by the overhead added by the MigratoryData protocol as well as by the TCP/IP protocol, resulting in an extra 131 bytes per message.
In fact, the overhead introduced by the MigratoryData protocol and the TCP/IP protocol is even less than 131 bytes per message. When we calculated the bandwidth – using the accurate traffic reported by the kernel into /proc/net/dev – we included all outgoing traffic of the network interface. This traffic is almost entirely produced by messages being pushed to clients. However it also includes some additional traffic produced by several ssh sessions, the JMX monitoring console, as well as the acknowledgements sent to publishers for receiving the messages.

Latency
As defined in the Benchmark Setup section, latency is the time needed for a message to propagate from the publisher to the subscriber, via the MigratoryData server. When Benchpub creates a message it includes the creation time as part of it. In this way, Benchsub can compute the latency as the difference between the creation and reception times of the messages.
In addition to computing the latency for all messages received, Benchsub also calculates the average, standard deviation, and maximum. These latency statistics are computed incrementally for each new message received. In this way, statistics are obtained for all messages received, and not just for a sample size.
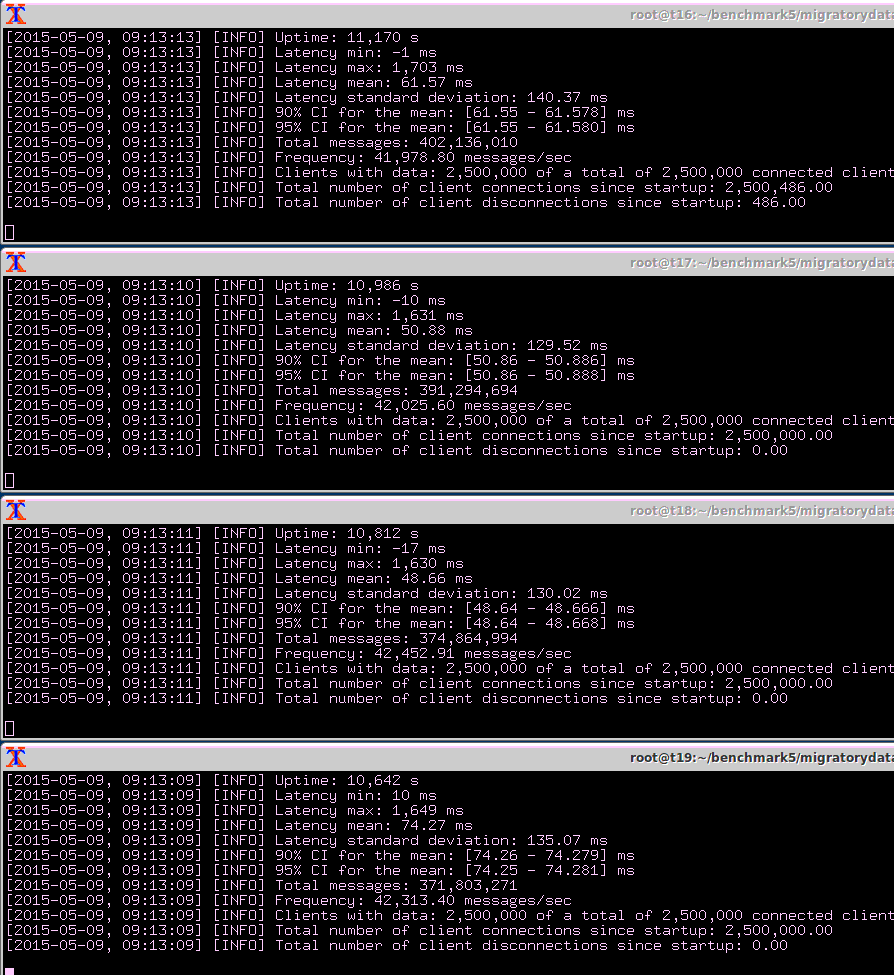
In the screenshot below, the “Total messages” information shows that each of the four Benchsub instances received around 400 millions messages during the 3 hours of benchmark test running. Therefore, the following latency statistics are very accurate, being computed on the entire population of more than 1.5 billion messages:
- Latency Mean is 61 milliseconds
- Latency Standard Deviation is 140 milliseconds
- Latency Maximum is 1.7 second
More Latency Statistics
In the previous section we explained that the latency statistics – mean, standard deviation, and maximum – were computed for all messages received by all 10 million clients. However, other stats that would be interesting to look at for a real-time service, including the median, 95th percentile and 99th percentile, cannot be computed incrementally. We need all latencies in order to be able to compute such extra statistics. Recording 1.5 billion latencies is not practical during a performance test, so we used sampling to estimate these additional statistics.
As outlined in the Benchmark Setup section, we used a fifth Benchsub instance to collect samples for 100 concurrent users from the entire population of 10 million. Each of the 100 users subscribed to a randomly selected subject from the 10 million available.
We recorded all latencies for each of the 100 users for 166 minutes during the benchmark test. Since each user received an average of one message per minute, we computed and recorded approximately 166 latencies for each user. Subsequently, we computed the median, average, 95th percentile, and 99th percentile for each of the 100 users (results are available as CSV file here, which also includes random subject each user subscribed to, as well as the precise number of messages received by each user).
Finally, we calculated a 99% confidence interval and we can estimate that, should we repeat the test, there is a 99% probability that the average value – for all users – would be as follows:
- Median Latency: 18.71 ms ± 1.29 ms
- Mean Latency: 58.52 ms ± 2.83 ms
- 95th Percentile Latency: 374.90 ms ± 21.51 ms
- 99th Percentile Latency: 585.06 ms ± 17.16 ms
Summary of Results
| Number of concurrent client connections | 10,000,100 |
| Number of concurrent subscribed subjects | 10,000,000 |
| Number of messages per client | 1 message per minute |
| Payload of each message | 512 random bytes |
| Total messages throughput | 10,080,000 messages per minute |
| Median latency | 18 milliseconds |
| Average latency | 61 milliseconds |
| Standard deviation for latency | 140 milliseconds |
| 95th percentile latency | 374 milliseconds |
| 99th percentile latency | 585 milliseconds |
| Maximum latency | 1.7 seconds |
| Hardware | One Dell PowerEdge R610 with 2 x Intel Xeon X5650 CPU at 2.66 GHz and 96 GB RAM |
| Operating system | CentOS / RHEL 7.1 with the default kernel 3.10.0-229 (without kernel recompilation) |
| CPU utilization | under 50% |
| Network utilization | 0.8 Gigabit per second |
From our observations, in the absence of minor and major JVM Garbage Collections, all of the latency statistics above should be around the median values at 18 milliseconds. For example, the maximum latency above was introduced by a major JVM Garbage Collection. However, as major Garbage Collections happen rarely, in real life, such a high latency will occur only a few times per day.
Configuration Tuning
The benchmark test used standard configurations of Linux Kernel, Java Virtual Machine, and MigratoryData Server with only a few changes, which I am going to detail below.
Linux Kernel
MigratoryData Server ran on a machine with CentOS / RHEL 7.1 out of the box. In order to demonstrate that MigratoryData Server is able solve the C10M problem on commodity hardware and operating systems typically found in data centers, we did not recompile the kernel, but used the default 3.10.0-229 kernel.
The only system configurations we made are as follows:
- Increased the number of socket descriptors, in order to allow the system to handle 10 million sockets:
- used the sysctl configuration fs.file-max=12000500
- echo 20000500 > /proc/sys/fs/nr_open
- ulimit -n 20000000
- Increased the maximum number of memory pages for TCP using the sysctl configuration:
- net.ipv4.tcp_mem=10000000 10000000 10000000
- Adjusted the buffers of TCP connections with sysctl for better memory usage, as follows:
- _net.ipv4.tcp_rmem=1024 4096 16384 _
- _net.ipv4.tcp_wmem=1024 4096 16384 _
- _net.core.rmem_max=16384 _
- net.core.wmem_max=16384
-
Statically balanced the hardware interrupts of the network adapter across the logical CPUs using smp_affinity. The Intel X520-DA2 network adapter has 24 tx/rx queues, each having a hardware interrupt (in the /proc/interrupts there are 24 entries for the p1p1 network interface). Coincidentally, the server also has 24 logical processors corresponding to its two six-core CPUs. We used smp_affinity to statically map each interrupt of the 24 tx/rx queues of the network adapter to each of the 24 logical processors.
-
Better use of Translation-Lookaside Buffer (TLB) caches by the processor. These caches contain virtual-to-physical address translations and have a small number of entries with the most-recently used pages. Using huge pages of 2 MB instead of the normal 4 KB pages, a TLB entry can handle much more memory, thus making the CPU caching more efficient. Because we allocated 54 GB to the Java Virtual Machine which ran the MigratoryData server, we reserved 60 GB huge pages (30720 huge pages x 2 MB / huge page) using the sysctl configuration:
- vm.nr_hugepages=30720
Java Virtual Machine
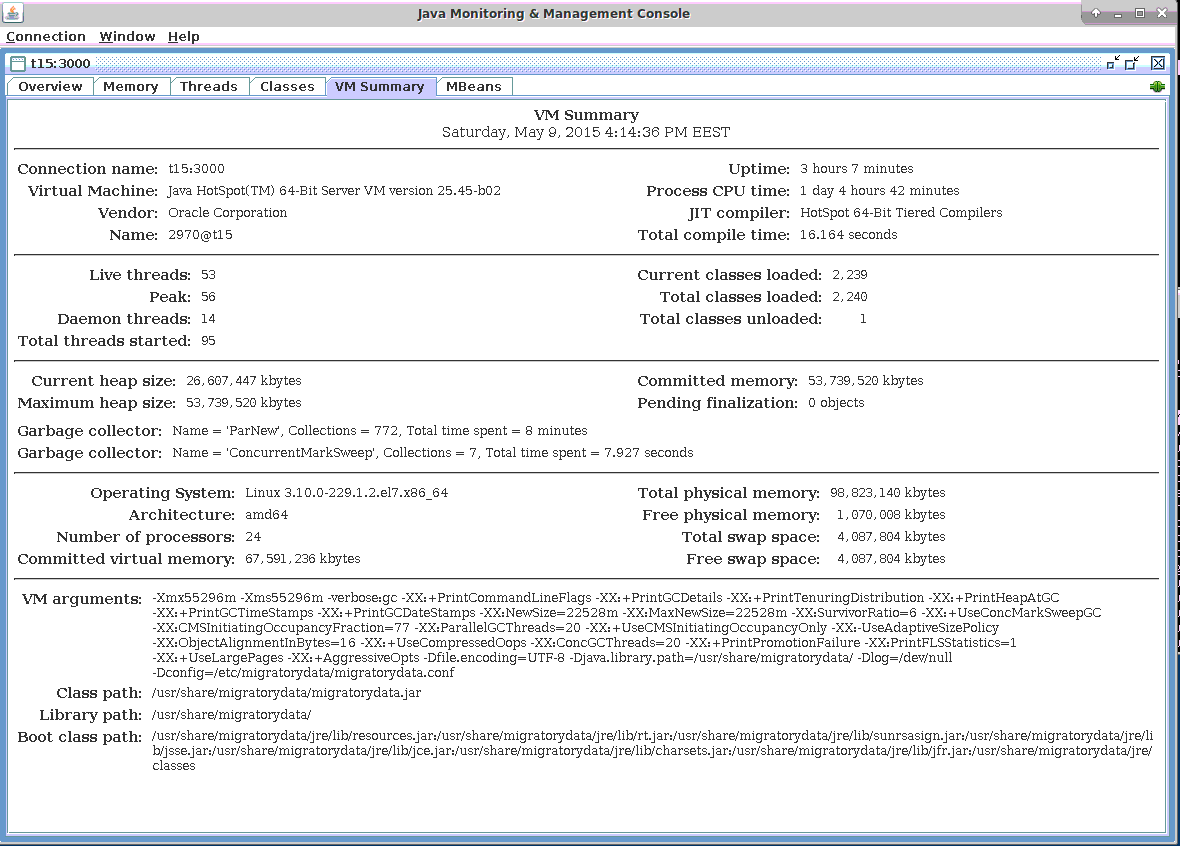
We used Oracle Java 1.8 update 45. Here are the main Java Virtual Machine (JVM) parameters we used (all JVM parameters can be seen in the screenshot below):
-
Allocated 54 GB for the JVM
-
Used Concurrent Mark Sweep (CMS) Garbage Collector
-
Enabled huge pages as discussed in the Linux Kernel subsection above by using:
- +UseLargePages
- Used compressed pointers, extended beyond the usual 32 GB limit, in order to optimize the memory footprint (with about 10 GB) by using:
- -XX:ObjectAlignmentInBytes=16 -XX:+UseCompressedOops
MigratoryData Server
We used MigratoryData Server 5.0.14. To its default configuration, we made the following changes:
- Enabled the JMX monitoring through the port 3000 (without authentication, and via an unencrypted connection):
- Monitor = JMX
- MonitorJMX.Authentication = false
- MonitorJMX.Listen = 192.168.3.115:3000
- Configured parallelism. In order to better scale on multiprocessor servers incoming users are separated in workgroups based on their IP address. Workgroups run in parallel, using almost independent threads. Thus, we used the following parameters related to parallelism:
- Worgroups = 10
- IoThreads = 20
- Distributed users across workgroups. Because all 10 million users came from only four IP addresses, originating from the four Benchsub instances, we used a parameter called BenchmarkMode in order to distribute users across workgroups as would happen in real life when they would all come from different IP addresses. To achieve this, we used the configuration:
- BenchmarkMode = true
- Reduced the default initial size of the buffers. When handling a message, a buffer of 8192 bytes is created. If the message is higher than 8192 bytes, the buffer automatically expands in order to hold the entire message. On the other hand, if the messages is smaller than 8192 some memory space remains unused. Because we know the payload of our messages is 512 bytes, we reduced the default initial size of the buffers from 8192 to 768 using the following parameters (note that the name of the parameters is quite misleading; it’s not a hard coded limit but a default initial size):
- BufferLimit.Send = 768
- BufferLimit.Receive = 768
- Reduced memory footprint and allowed better performance by using a native C implementation with JNI for socket handling:
- X.Native.Io = true
Conclusion
In a talk cited by HighScalability.com, Robert Graham discussed the C10M problem. He explains why the kernel could be more of a problem than a solution for achieving high scalability and suggested a number of principles for building scalable systems.
Looking at slabtop in the screenshot of the Network Utilization subsection above, we observe that the Linux kernel used around 32 GB to maintain open the 10 million concurrent socket connections. For usual systems, 3.2 KB per socket connection could seem quite reasonable. However with the explosion of Internet devices (mobiles and Internet of Things) we see systems requiring millions of concurrent connections more and more frequently. We therefore echo Robert’s concern on the kernel and think that Linux might, for example, provide better memory usage to handle socket connections.
Moreover, many of the principles discussed by Robert can be found in our approach presented above: do as much as possible outside the kernel, use an efficient thread model to scale across all processors, use huge pages to optimize CPU caches, and distribute interrupts across all processors.
That said, in this post we demonstrated that solving the C10M problem is feasible with MigratoryData Server using a commodity server and an off-the-shelf Linux distribution. Also, given the millions of end users that our customers have, who receive real-time data daily with MigratoryData Server running on Linux, the time for easily building highly scalable real-time Internet services is now, with existing ingredients: Linux operating system, MigratoryData’s real-time Web server, and MigratoryData’s API with libraries for almost any Internet technology (Web, Mobile, Desktop, Server, Internet of Things).
To learn more about MigratoryData Server and how it can help your business achieve effective high scalability, please visit migratorydata.com.