This article presents a new benchmark designed for a smart factory use case. It demonstrates MigratoryData’s effectiveness in handling large numbers of users and devices, while delivering high volumes of real-time messages with minimal latency.
Benchmark Scenario
In a smart factory, users and devices are organized in groups of 20. These groups require frequent updates with real-time messages, each containing 500 bytes of data on average. Ensuring security and guaranteed message delivery is crucial to protect sensitive information and maintain the integrity and high availability of the system, even in the face of hardware failures and network disconnections.
Benchmark Tools
MigratoryData’s Benchmark Tools consists of Benchsub and Benchpub.
Benchsub
Benchsub is a tool that can open a configurable number of WebSocket connections to the MigratoryData server, subscribe to a configurable number of subjects, and measure the time it takes to receive messages for those subjects.
Benchpub
Benchpub is tool capable of publishing messages of a configurable size at a configurable frequency to the MigratoryData server.
Benchmark Setup
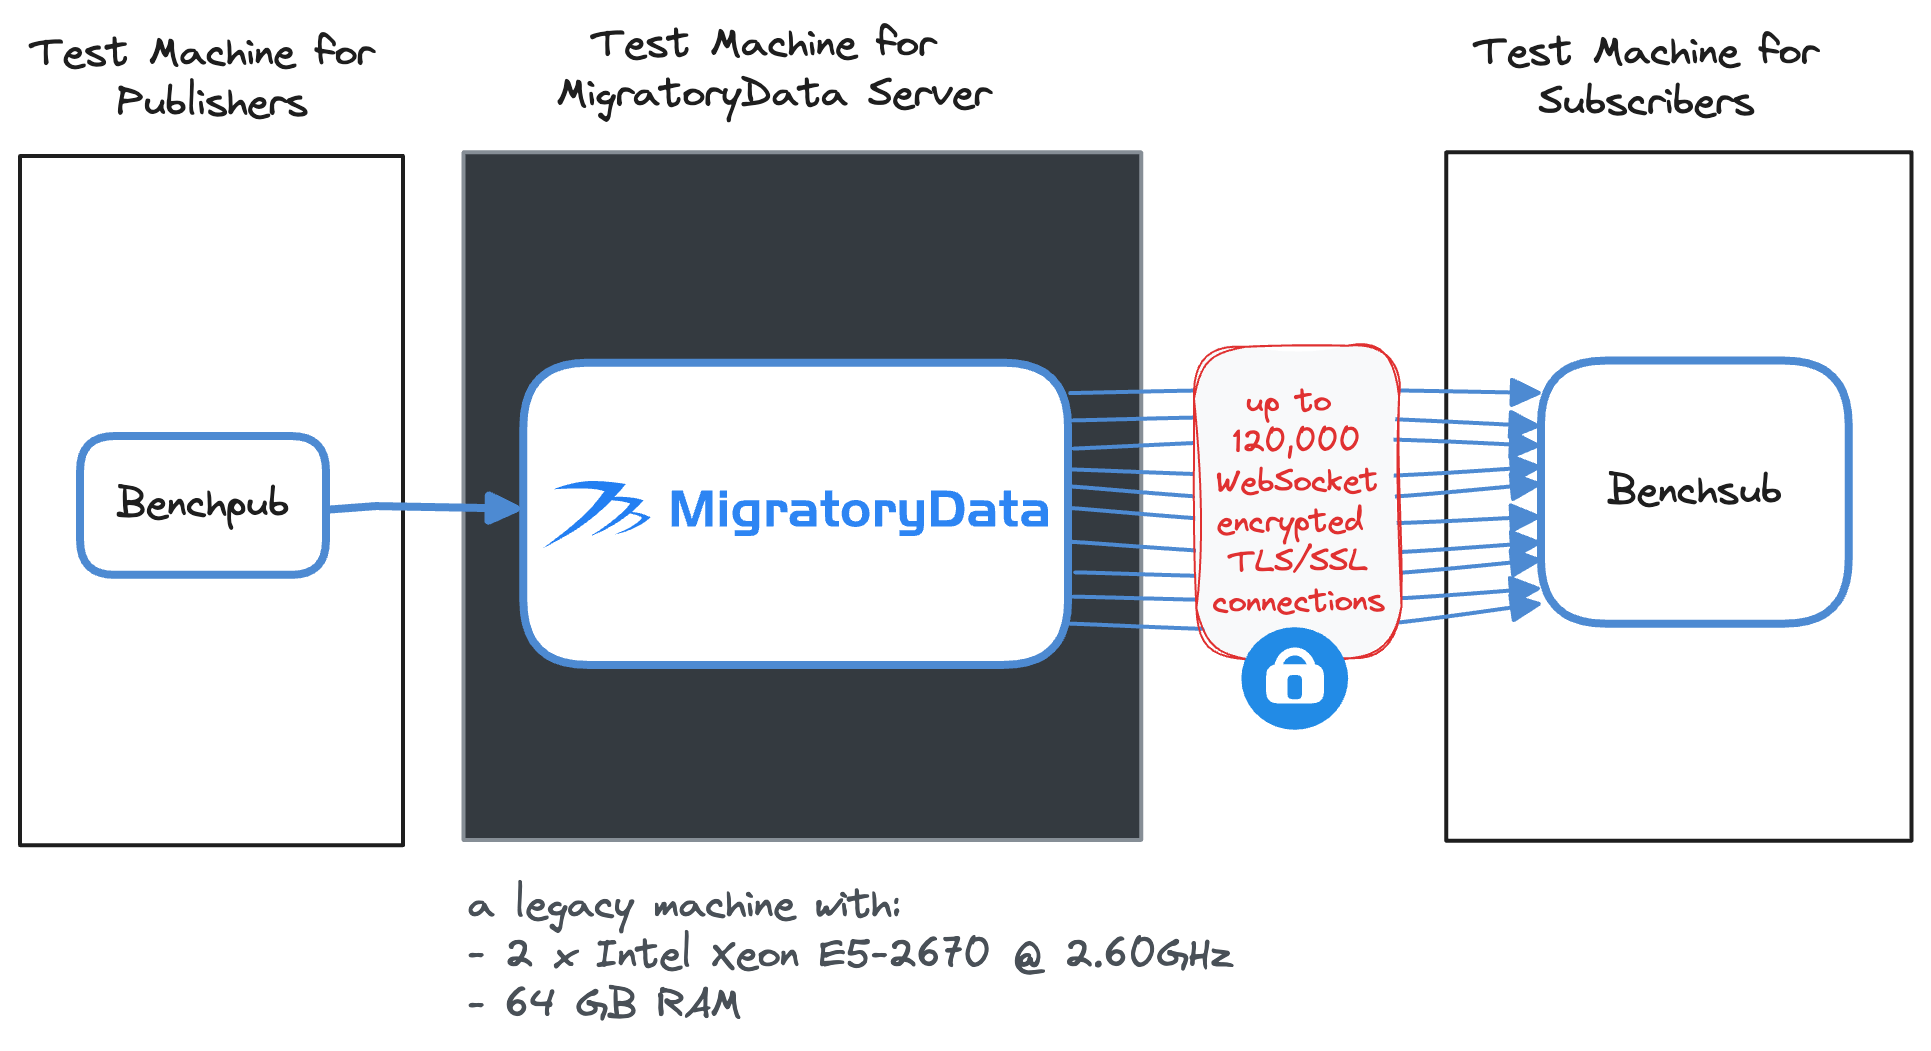
The following diagram shows the hardware used for the benchmark tests, and how the benchmark tools and the MigratoryData server were distributed across the hardware.
♦ A single instance of the MigratoryData server, with Guaranteed Message Delivery feature enabled, was hosted on its own dedicated machine. To showcase its strong performance even on modest hardware, we employed a 10-year-old legacy machine with the following specifications:
- 2 x Intel Xeon E5-2670 @ 2.60GHz CPUs
- 64 GB RAM
♦ A separate machine was used to host the Benchpub tool, which published real-time messages at varying frequencies as described below.
♦ Finally, we used another separate machine for the Benchsub tool to simulate up to 120,000 concurrent devices. This involved opening up to 120,000 concurrent WebSocket connections with TLS/SSL encryption, subscribing to various subjects, and receiving real-time messages for those subjects as further detailed below.
Summary of Results
The table below provides a summary of the benchmark results obtained during 4 benchmark tests with a single instance of the MigratoryData server for the benchmark scenario above:
| Test 60K | Test 80K | Test 100K | Test 120K | |
|---|---|---|---|---|
| Total clients | 60,000 | 80,000 | 100,000 | 120,000 |
| Total subjects | 3,000 | 4,000 | 5,000 | 6,000 |
| Subjects per client |
1 | 1 | 1 | 1 |
| Messages per second per client | 1 | 1 | 1 | 1 |
| Message size (random bytes) | 500 | 500 | 500 | 500 |
| Total incoming messages per second | 3,000 | 4,000 | 5,000 | 6,000 |
| Total outgoing messages per second | 60,000 | 80,000 | 100,000 | 120,000 |
| Mean latency |
3.5 | 3.5 | 3.6 | 3.8 |
| Max latency |
112 | 148 | 172 | 227 |
| CPU utilization (mean) | < 32% | < 39% | < 41% | < 45% |
| RAM utilization | < 24GB | < 24GB | < 24GB | < 24GB |
| Using TLS/SSL encryption for clients | yes | yes | yes | yes |
| Using Debian Linux kernel 4.19.0-17-amd64 | yes | yes | yes | yes |
Results
We used the built-in Prometheus and Grafana monitoring feature of the MigratoryData server. Below, we present the benchmark results in the form of screenshots obtained from Grafana and from Benchsub tool.
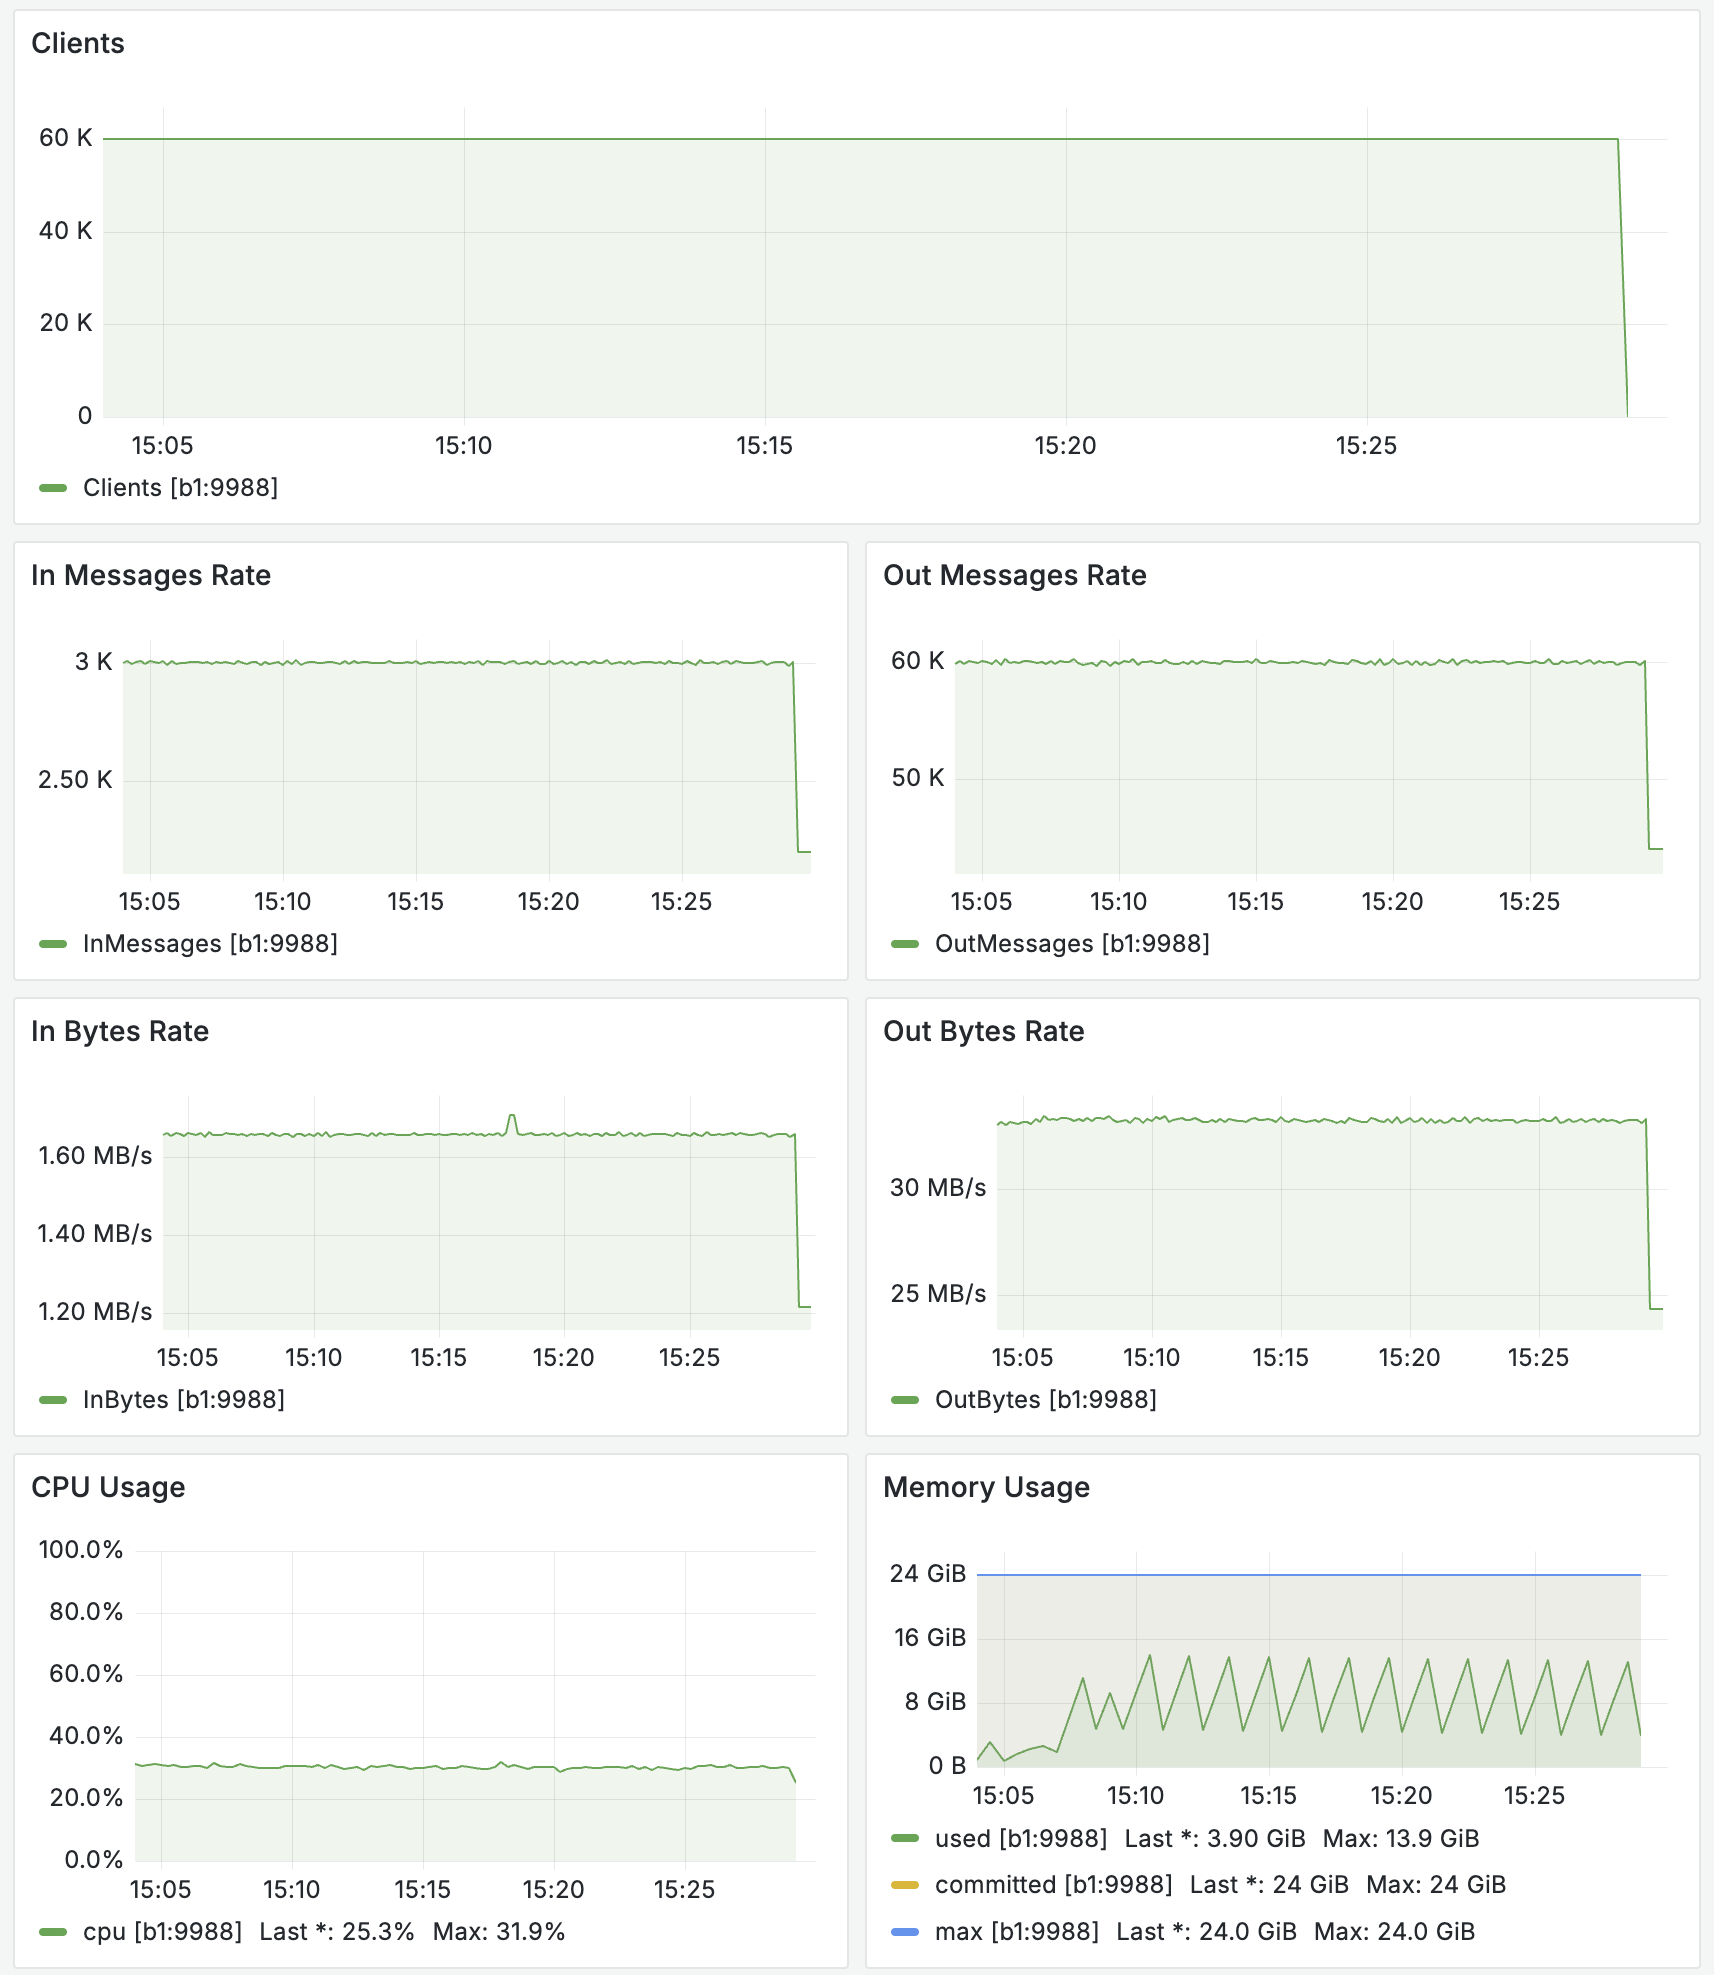
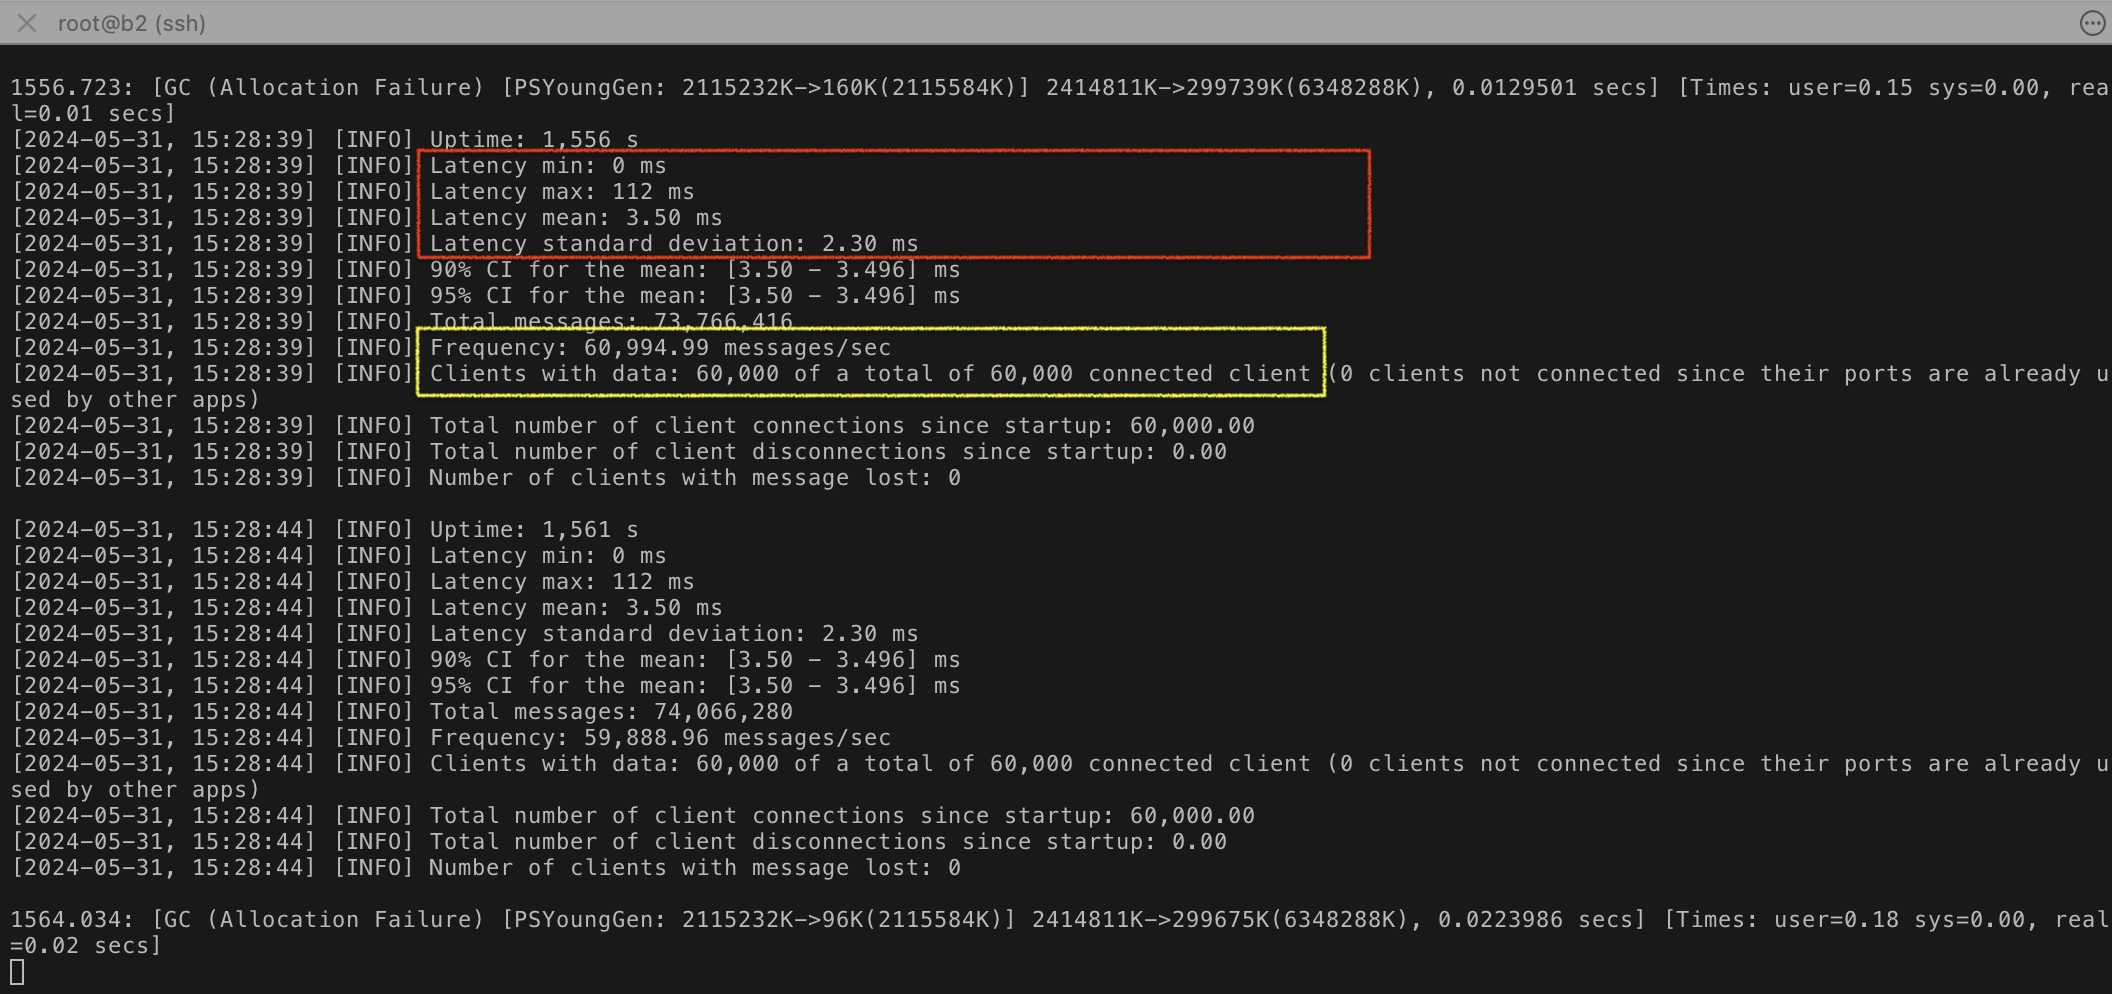
Test 60K
This Grafana screenshot displays the metrics for the MigratoryData server during this benchmark test. It includes the number of clients, the incoming and outgoing message and byte rates, as well as CPU and memory utilization.
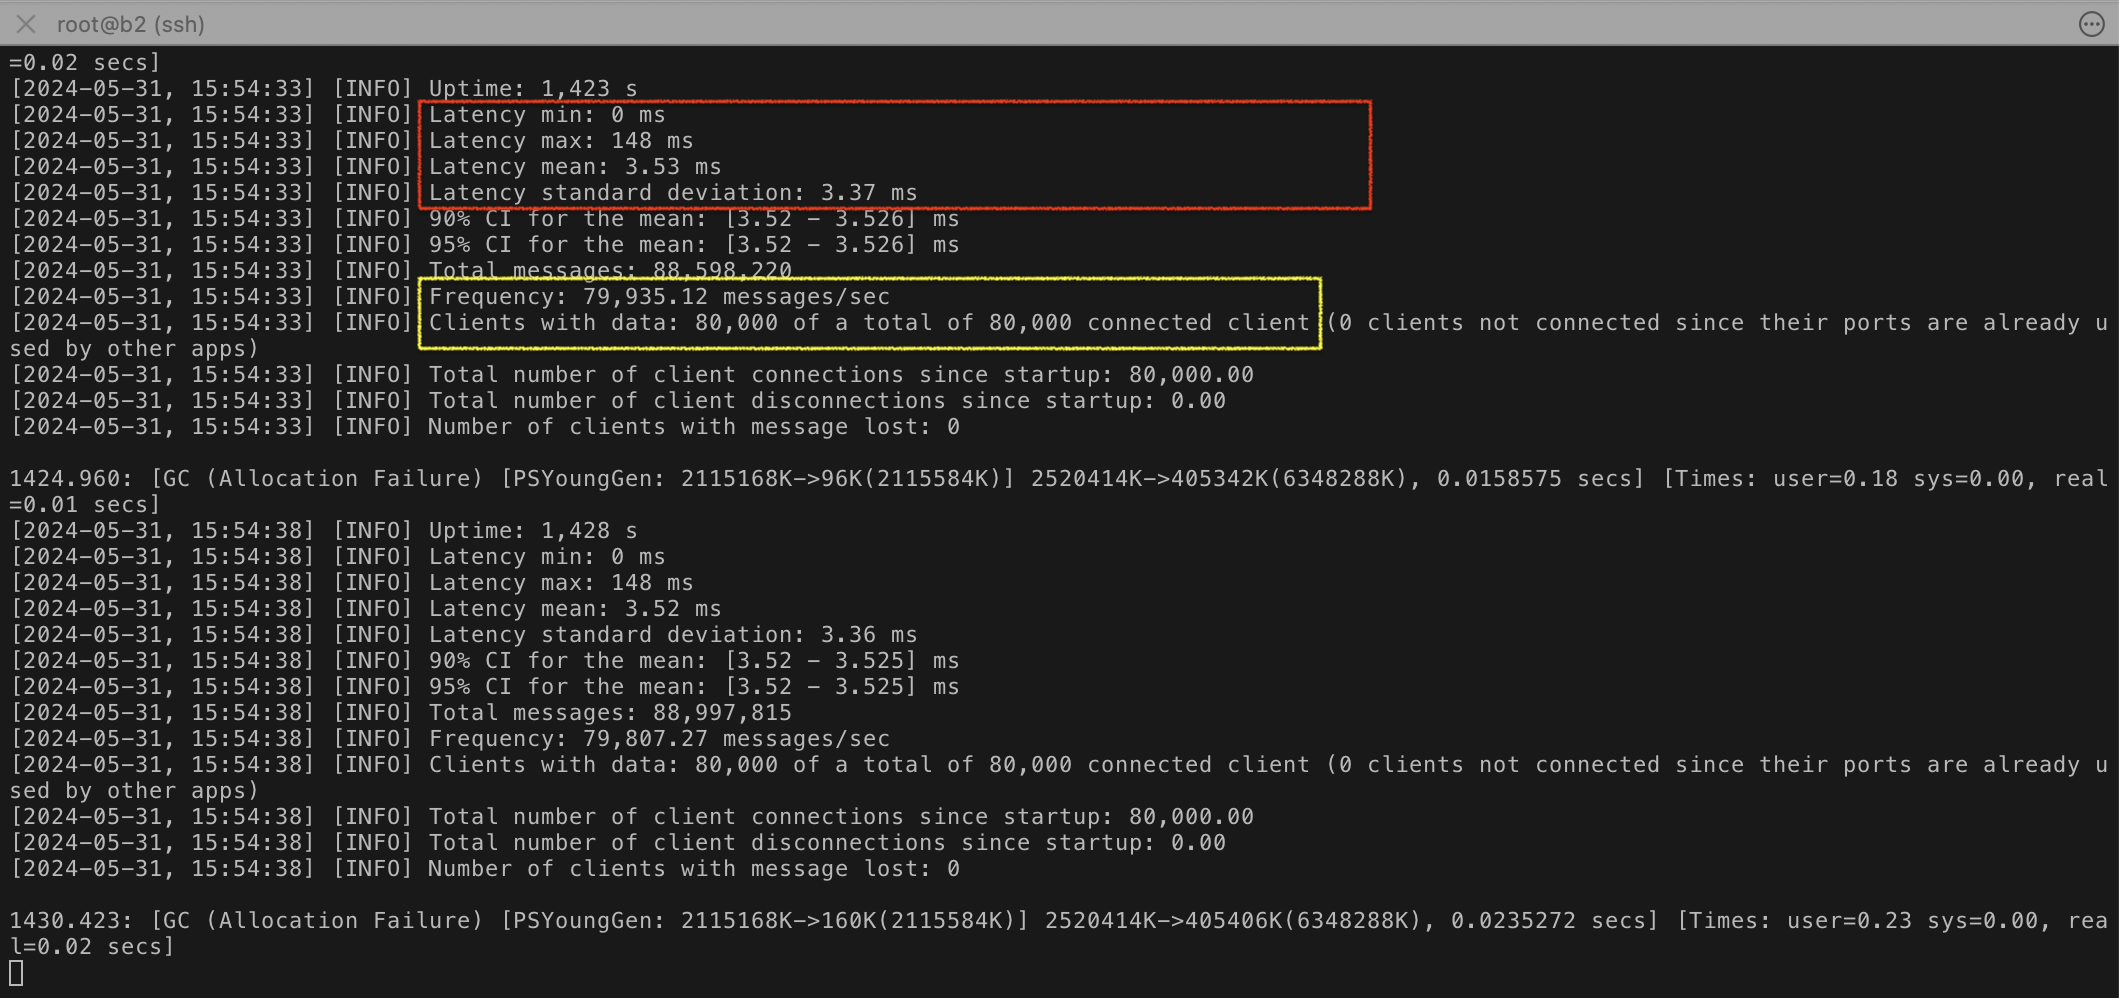
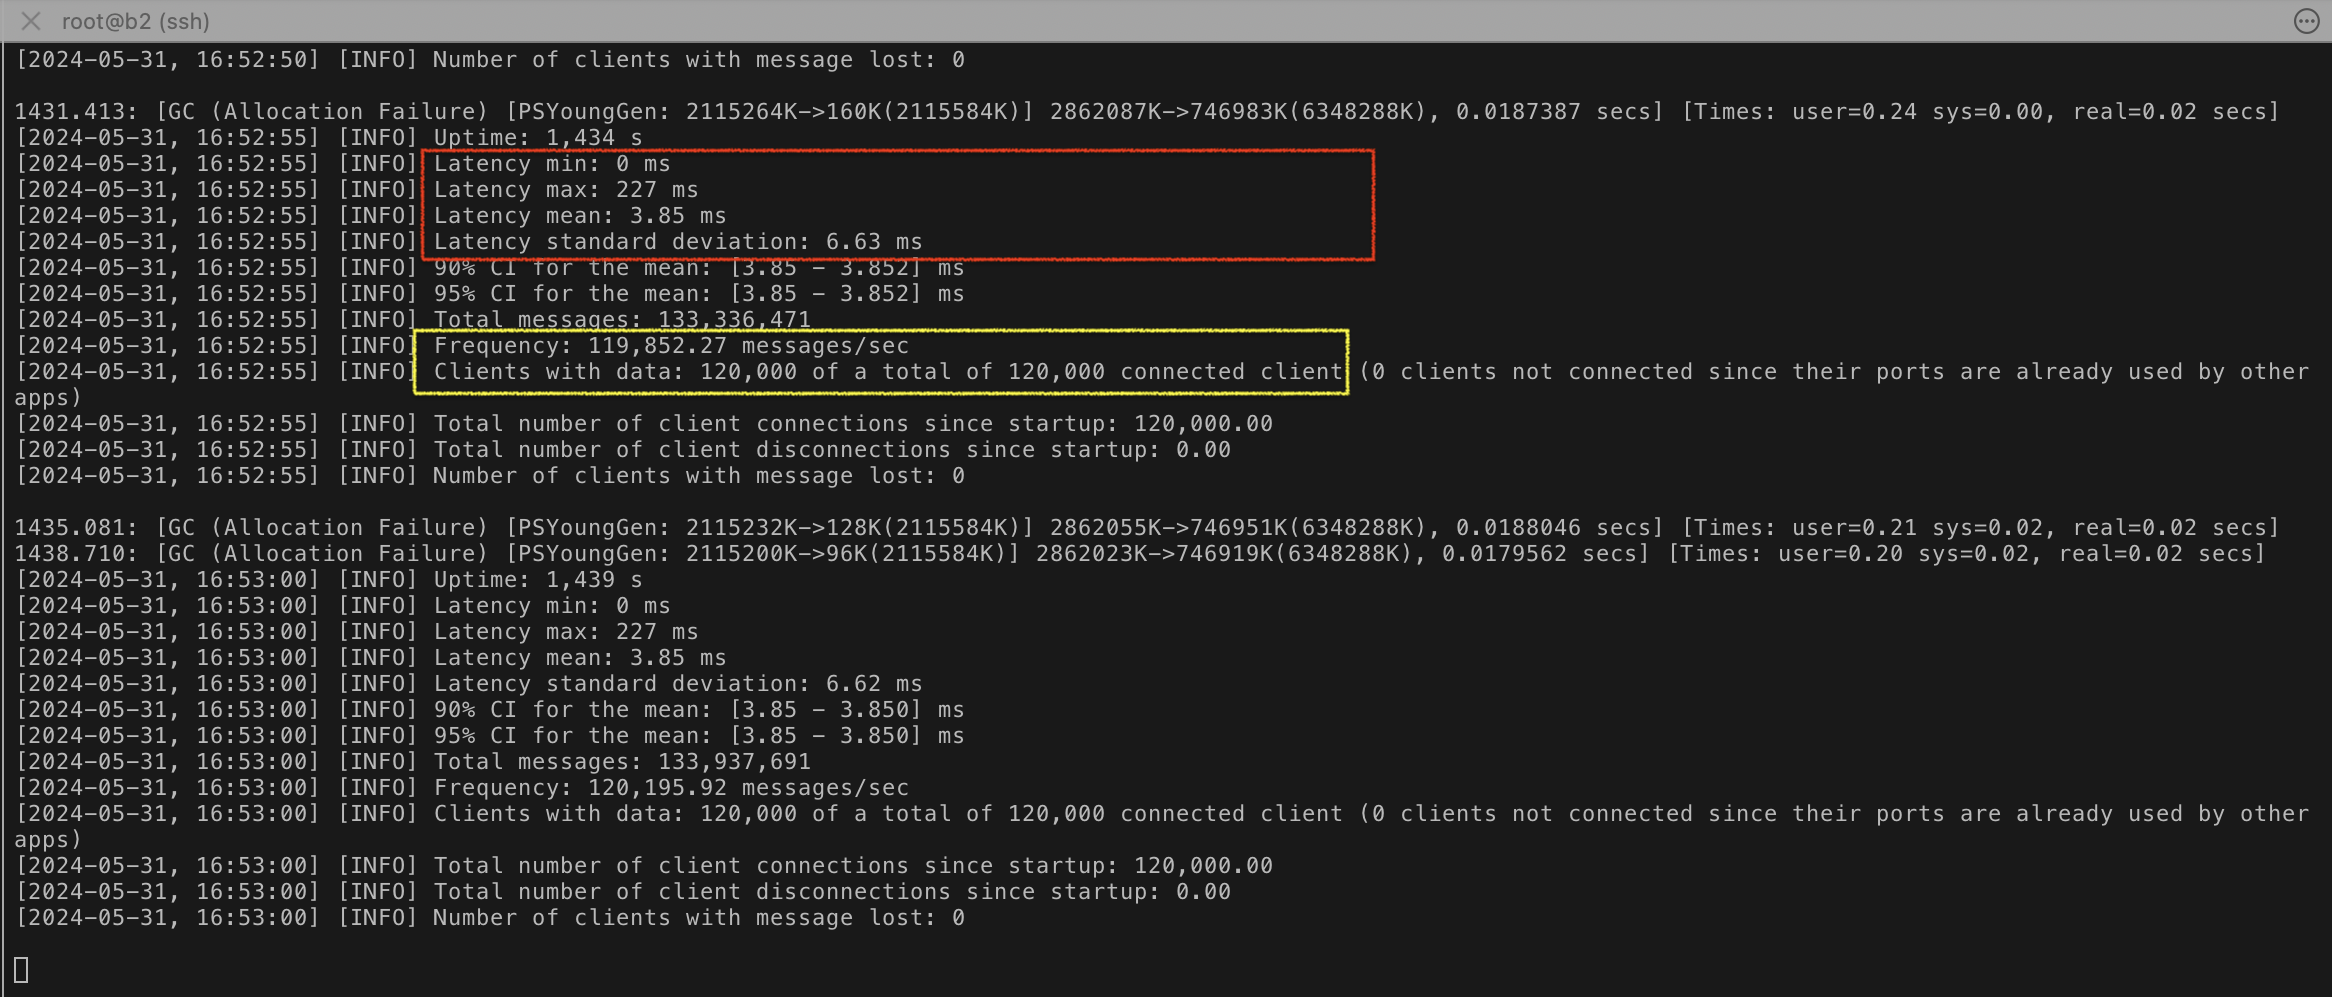
This screenshot from the Benchsub tool displays latency information, the number of client connections opened to the MigratoryData server, and the incoming message rate:
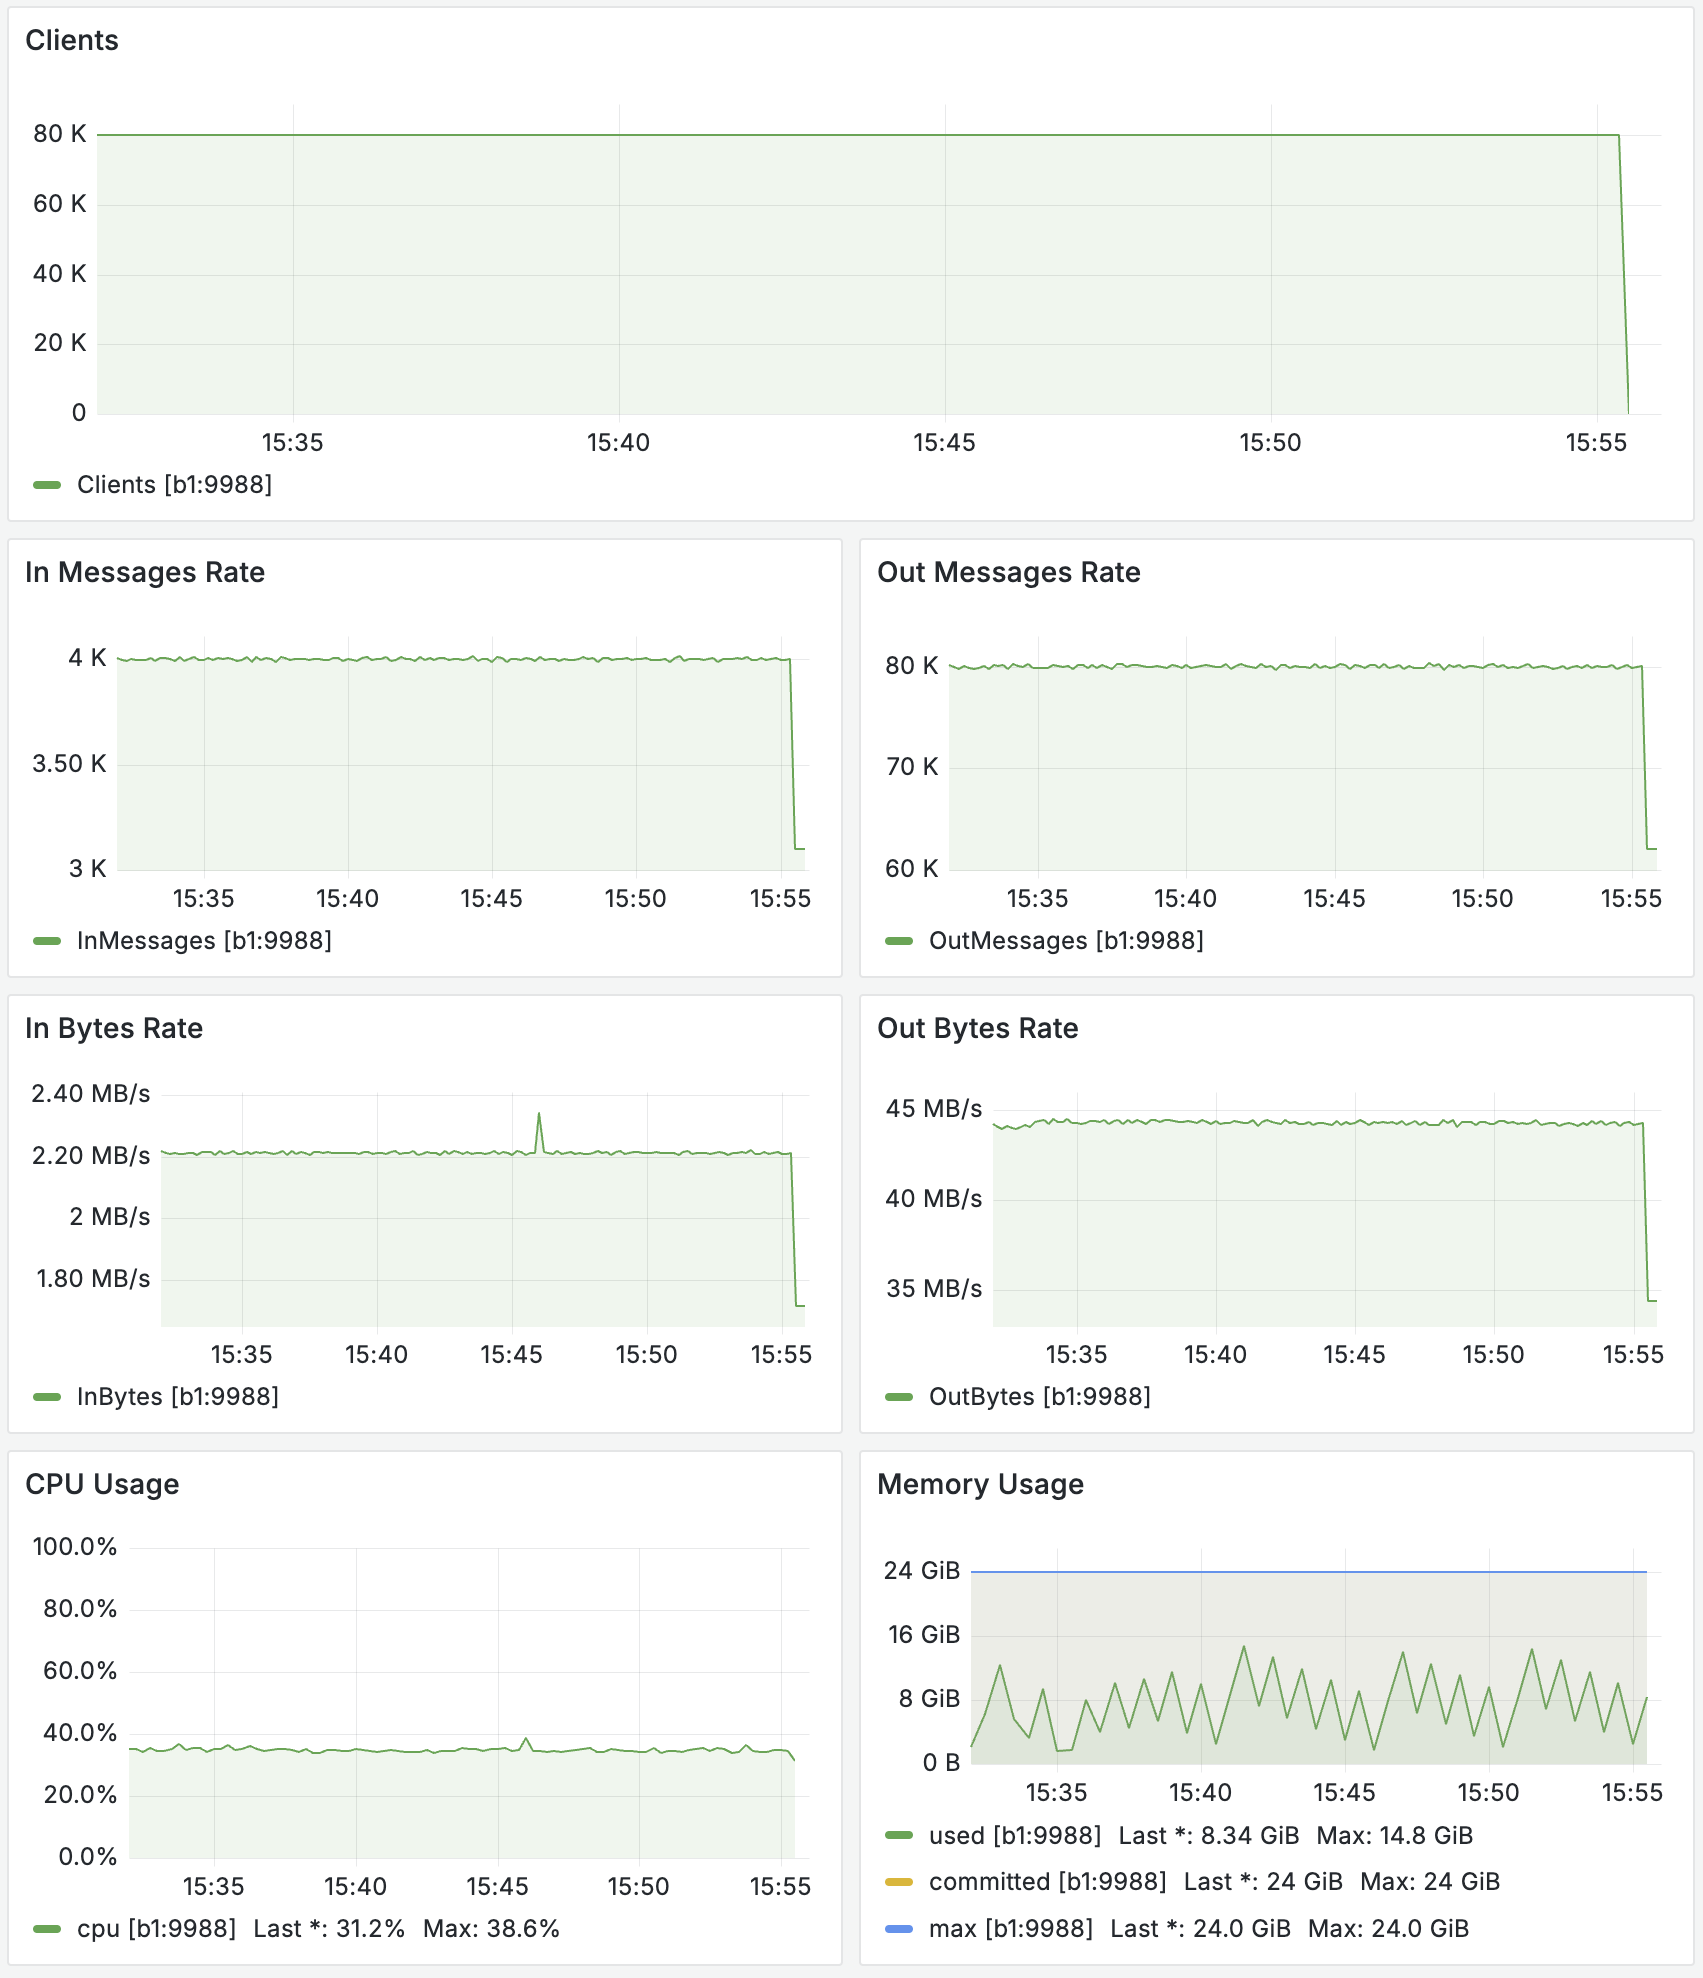
Test 80K
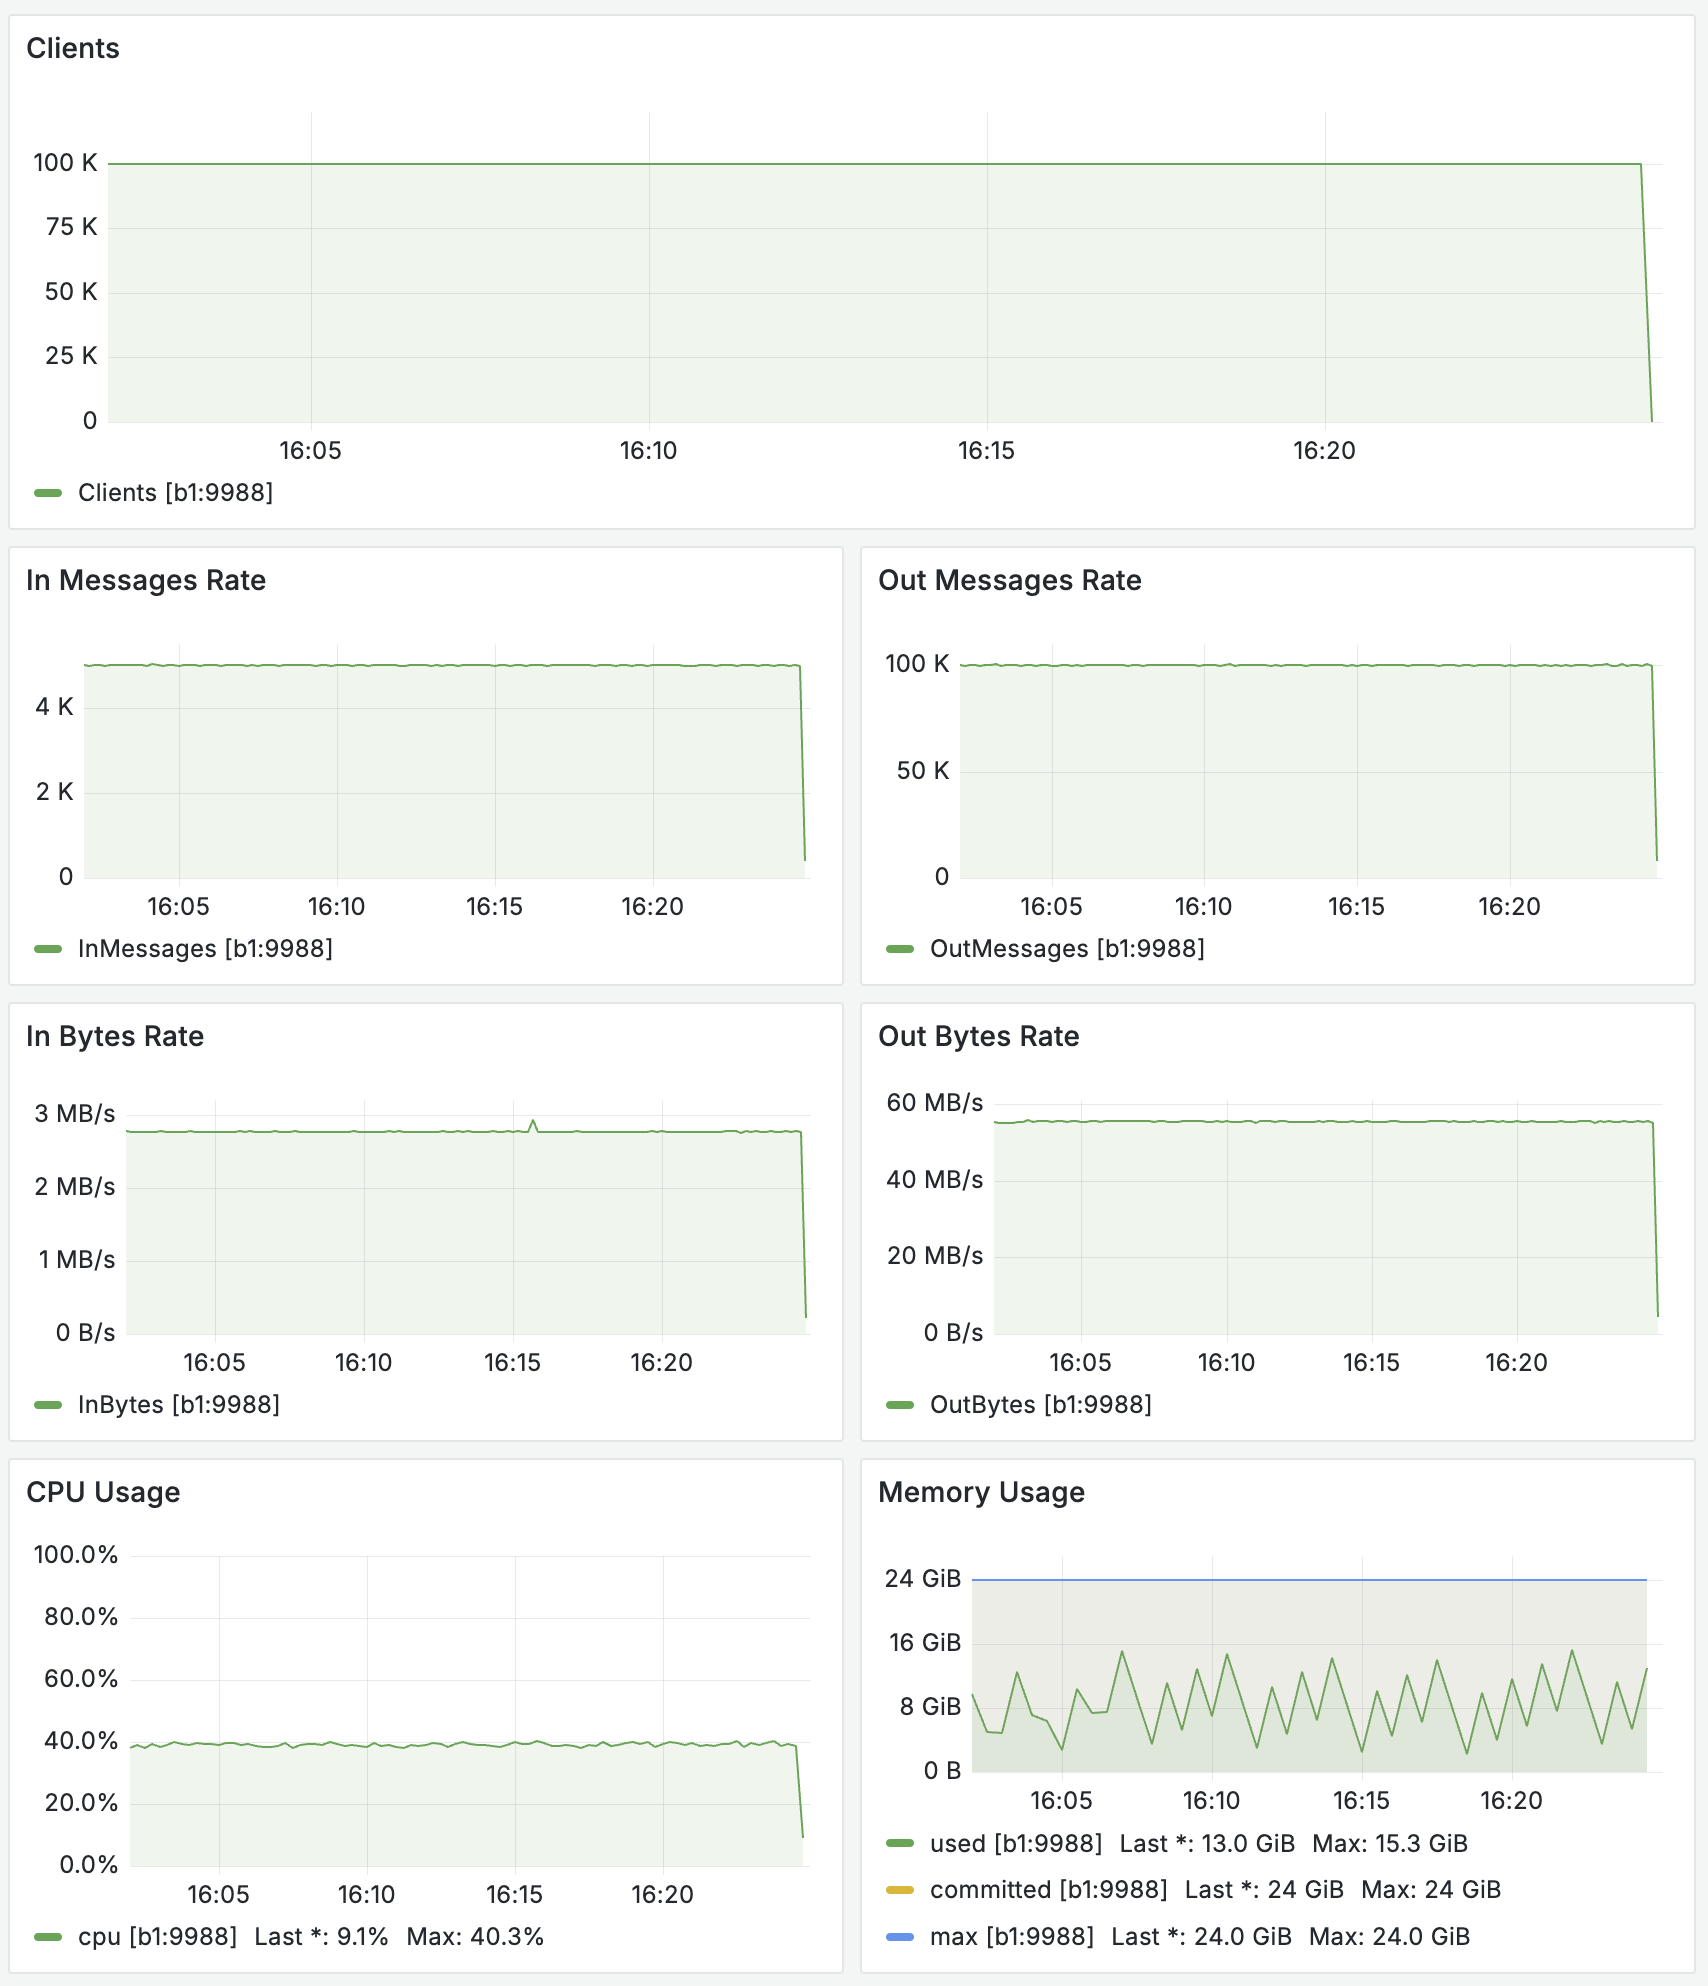
This Grafana screenshot displays the metrics for the MigratoryData server during this benchmark test. It includes the number of clients, the incoming and outgoing message and byte rates, as well as CPU and memory utilization.
This screenshot from the Benchsub tool displays latency information, the number of client connections opened to the MigratoryData server, and the incoming message rate:
Test 100K
This Grafana screenshot displays the metrics for the MigratoryData server during this benchmark test. It includes the number of clients, the incoming and outgoing message and byte rates, as well as CPU and memory utilization.
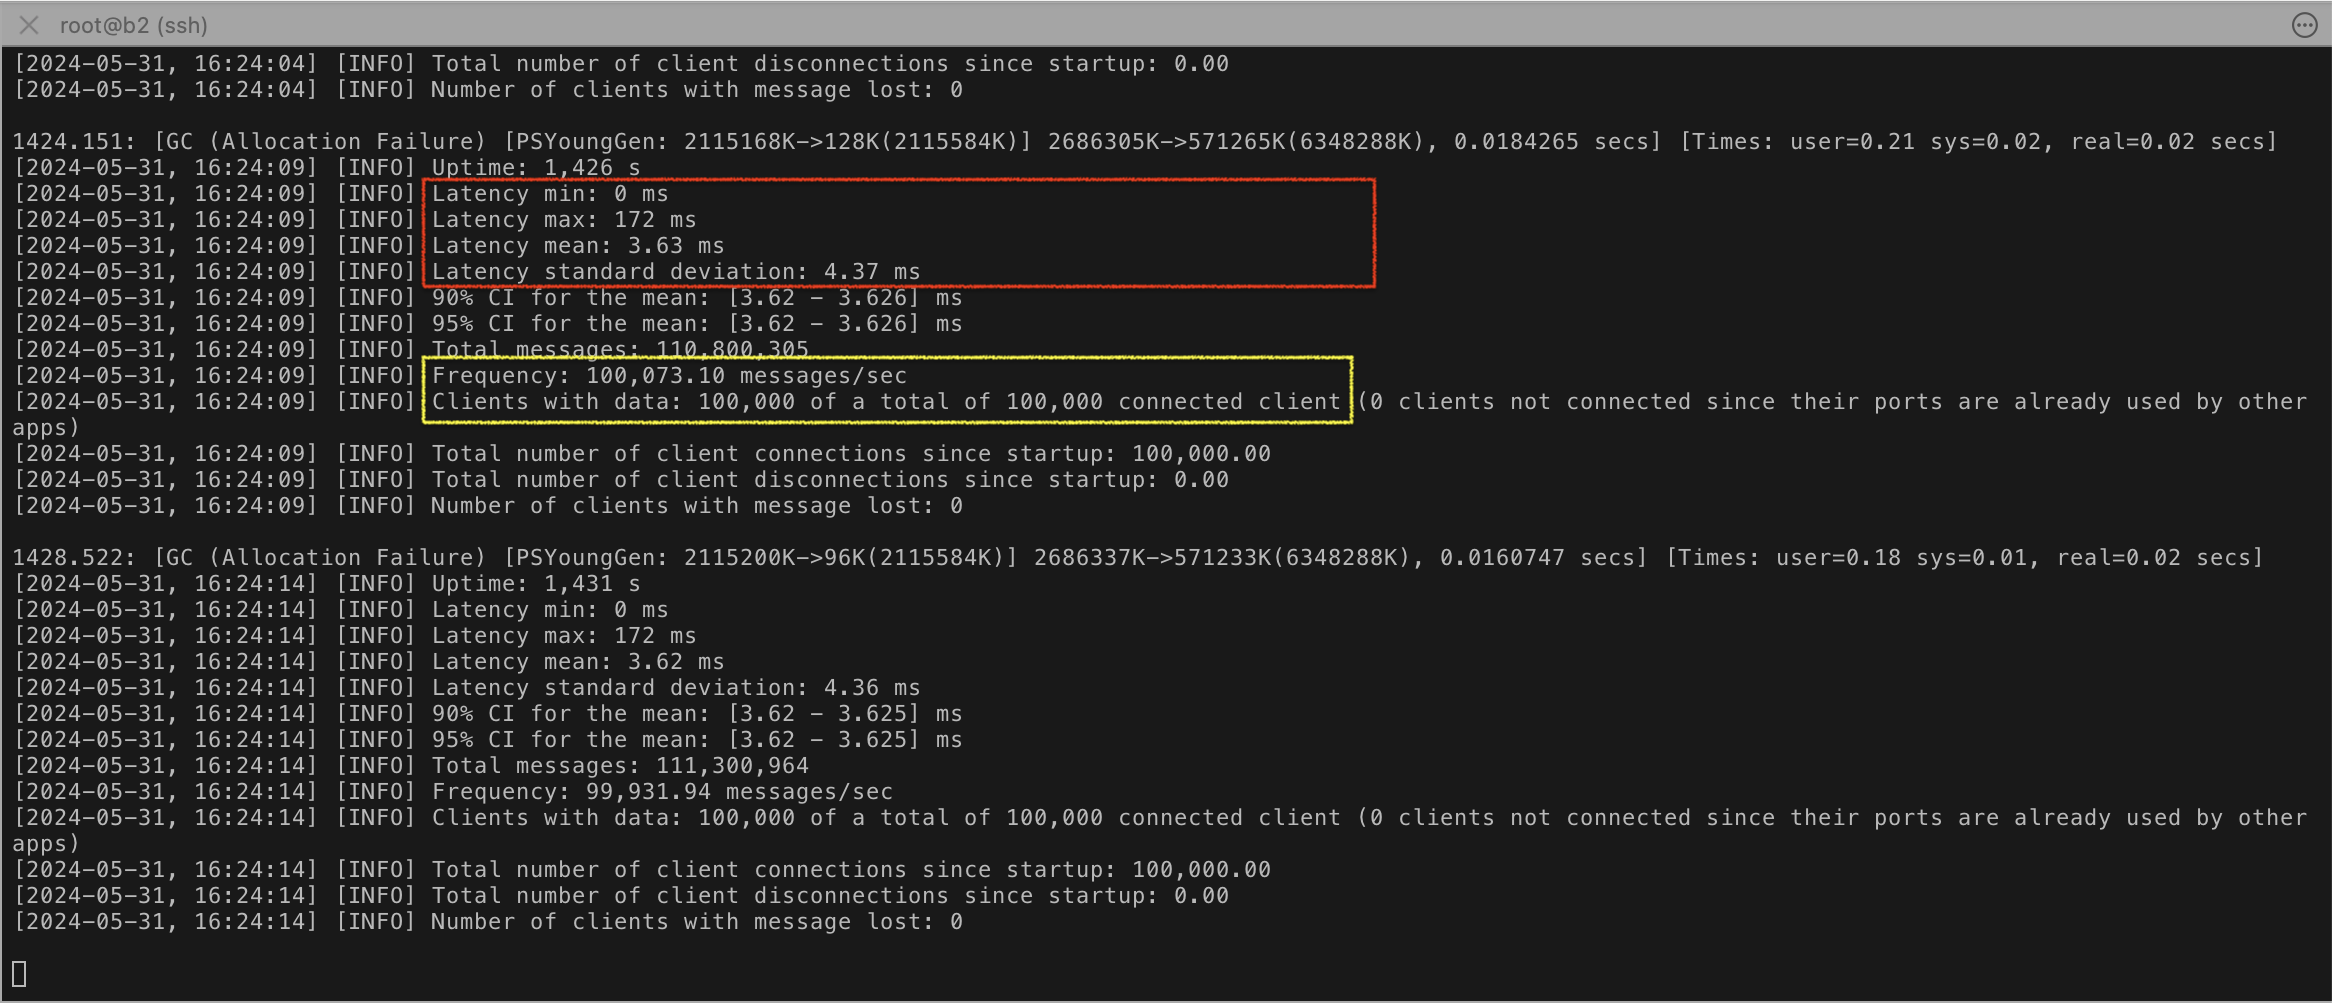
This screenshot from the Benchsub tool displays latency information, the number of client connections opened to the MigratoryData server, and the incoming message rate:
Test 120K
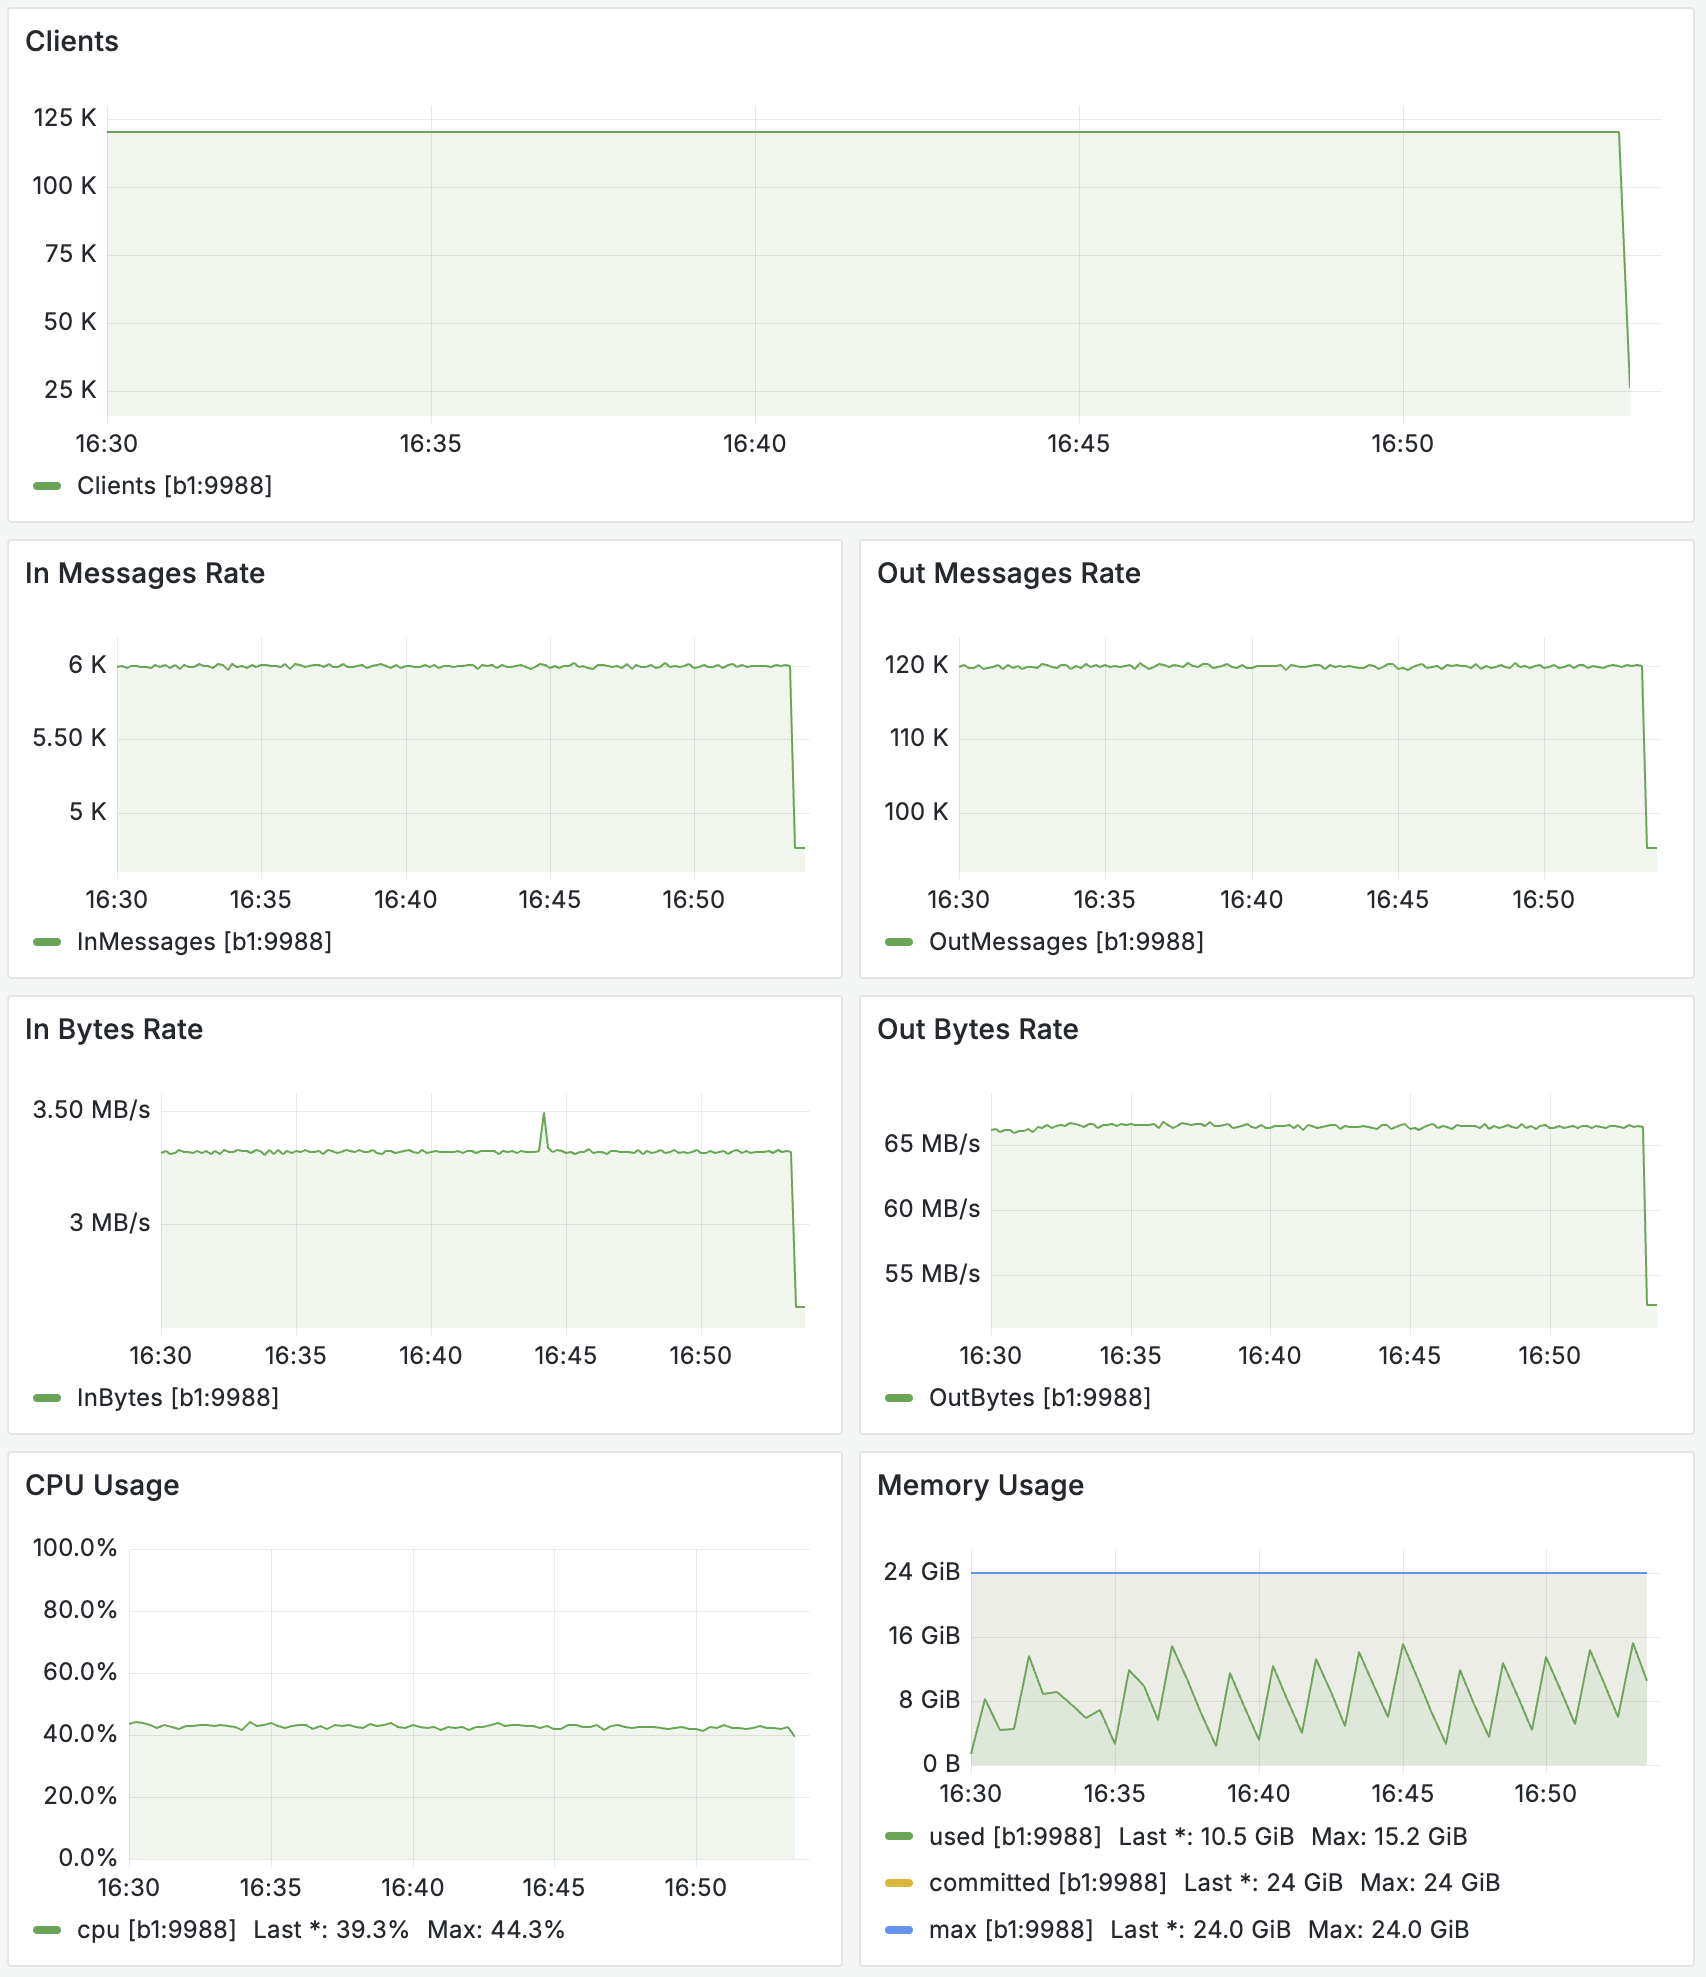
This Grafana screenshot displays the metrics for the MigratoryData server during this benchmark test. It includes the number of clients, the incoming and outgoing message and byte rates, as well as CPU and memory utilization.
This screenshot from the Benchsub tool displays latency information, the number of client connections opened to the MigratoryData server, and the incoming message rate:
Conclusion
In this blog post, we showcased that a single instance of the MigratoryData server can:
- Handle up to 120,000 concurrent clients
- Update all clients every second with real-time messages
- Deliver real-time data with a low latency of under 4 milliseconds
- Ensure secure data transmission over encrypted TLS/SSL connections
- Guarantee message delivery with no message loss, even during hardware failures and network disconnections
- Achieve all of these while using less than 45% CPU on a legacy machine
Finally, MigratoryData offers active/active clustering. Although a single instance of the MigratoryData server can manage the entire load from a performance perspective, it is recommended to use a cluster of two or three instances in production. This configuration provides fault tolerance by supporting the failure of any cluster member while ensuring Guaranteed Message Delivery.
We would welcome any questions, comments, criticisms, or suggestions you may have regarding this benchmark. Please email your feedback to support@migratorydata.com.

