
In our previous world-record-setting C10M benchmark, we showed that MigratoryData Server can achieve extreme high-scalability by delivering real-time messaging to 10 million concurrent users on a single 1U machine. Here, we show that MigratoryData Server can achieve simultaneously both extreme high-scalability and consistent low latency.
Written in Java, MigratoryData Server runs on a Java Virtual Machine (JVM). In the previous C10M benchmark, some JVM tuning adjustments were necessary such as using CMS garbage collector, enabling huge pages, and using compressed pointers.
In this post, we show that by simply replacing the JVM with Zing JVM out-of-the-box (without any tuning), and preserving the same C10M benchmark scenario and setup, we can reduce the average latency from 61 milliseconds to under 15 milliseconds. Moreover, and more importantly, the latency spikes can be significantly reduced from 585 milliseconds to 25 milliseconds for the 99th percentile latency and from 1700 milliseconds to 126 milliseconds for the maximum latency. Therefore, every single message can be delivered, even in the worst case, with almost no delay.
In summary, this new C10M benchmark demonstrates that **MigratoryData Server **running on a single 1U machine can handle 10 million concurrent clients each receiving a 512-byte message per minute (at a total bandwidth of 0.8 Gbps) with a consistent end-to-end latency of under 15 milliseconds.
Benchmark Setup
We used the same benchmark setup and config from the previous C10M benchmark (see sections “Benchmark Setup” and “Configuration Tuning”). The only changes were to replace the JVM with Zing JVM and not use huge pages.
MigratoryData Server is essentially a publish/subscribe system for web messaging. Subscribers are clients which connect to the MigratoryData server - using persistent WebSocket or HTTP connections - and subscribe to subjects (also known as topics). Publishers are clients which connect to the MigratoryData server and publish messages. A message consists mainly of a subject and some data. Upon receiving a message from a publisher, the MigratoryData server delivers that message to all clients which subscribed to the subject of that message.
To briefly describe the benchmark setup (full details, including the specifications of the machines, can be found in our previous C10M benchmark), nine machines were utilized as follows:
- One machine was utilized to run one instance of the MigratoryData server.
- In order to connect 10 million clients, four machines were utilized to run four instances of Benchsub, each opening 2.5 million HTTP persistent connections to the MigratoryData server. Also, Benchsub subscribed each client to a distinct subject.
- In order to send one message per minute to each client, four machines were utilized to run eight instances of Benchpub (two instances per machine) for publishing 168,000 messages/second (i.e. 10,080,000 messages/minute) to the MigratoryData server, each instance publishing 21,000 messages/second.
- Finally, a fifth Benchsub instance was used to connect 100 additional clients, representing samples of the population of 10 million concurrent clients. This Benchsub instance was used to compute supplemental latency statistics – in addition to the latency statistics computed by the other four Benchsub instances.
Latency is the end-to-end time needed for a message to propagate from the publisher to the subscriber, via the MigratoryData server. Thus, the latency of a message is the difference between the time at which the message is sent by Benchpub to the MigratoryData server and the time at which the message is received by Benchsub from the MigratoryData server.
Summary of Results
| Number of concurrent client connections | 10,000,100 |
| Number of concurrent subscribed subjects | 10,000,000 |
| Number of messages per client | 1 message per minute |
| Payload of each message | 512 random bytes |
| Total messages throughput | 10,080,000 messages per minute |
| Median latency | 13.8 milliseconds |
| Average latency | 13.2 milliseconds |
| Standard deviation for latency | 4.7 milliseconds |
| 95th percentile latency | 21.2 milliseconds |
| 99th percentile latency | 24.4 milliseconds |
| Maximum latency | 126 milliseconds |
| Hardware | One Dell PowerEdge R610 with 2 x Intel Xeon X5650 CPU at 2.66 GHz and 96 GB RAM |
| Operating system | CentOS / RHEL 7.1 with the default kernel 3.10.0-229 (without kernel recompilation) |
| CPU utilization | under 50% |
| Network utilization | 0.8 Gigabit per second |
Results
MigratoryData Server provides advanced monitoring via JMX and other protocols. We used the jconsole tool (part of the Java Development Kit) for JMX monitoring. In the results presented below we show screenshots obtained during JMX monitoring.
Connections and Messages
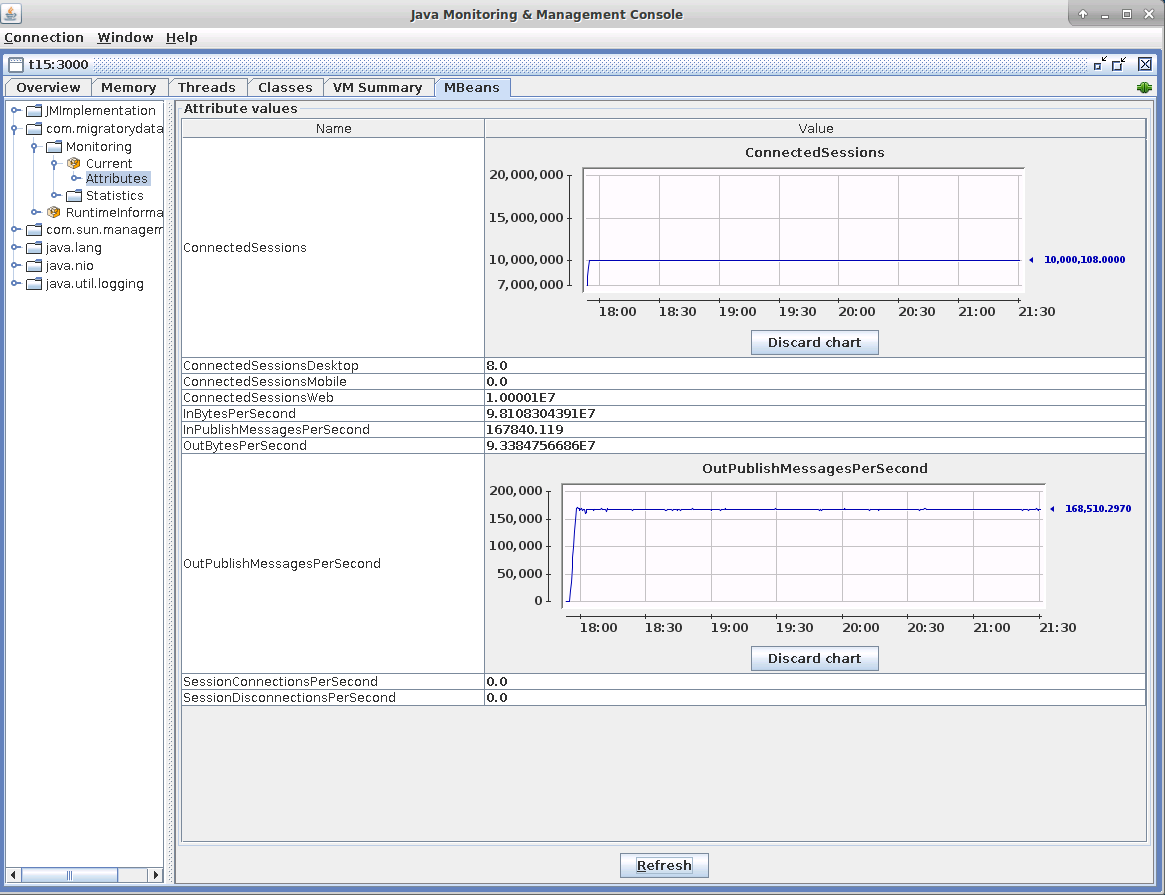
As mentioned in the Benchmark Setup section above, the 10 million concurrent connections were opened by four instances of Benchsub that simulated 2.5 million concurrent users each. In addition, a fifth instance of Benchsub opened another 100 concurrent connections. Indeed, the indicator ConnectedSessions of the JMX screenshot below shows around 10,000,100. The same number of concurrent socket connections is confirmed by the tools netstat and slabtop (see the screenshot in the Network Utilization subsection below).
As mentioned in the Benchmark Setup section above, eight Benchpub instances published 168,000 messages/second (i.e. 10,080,000 messages/minute) in order to produce one message per minute for each of the 10 million clients. The JMX indicator OutPublishMessagesPerSecond shows that the outgoing message throughput is indeed around 168,000 messages/second.
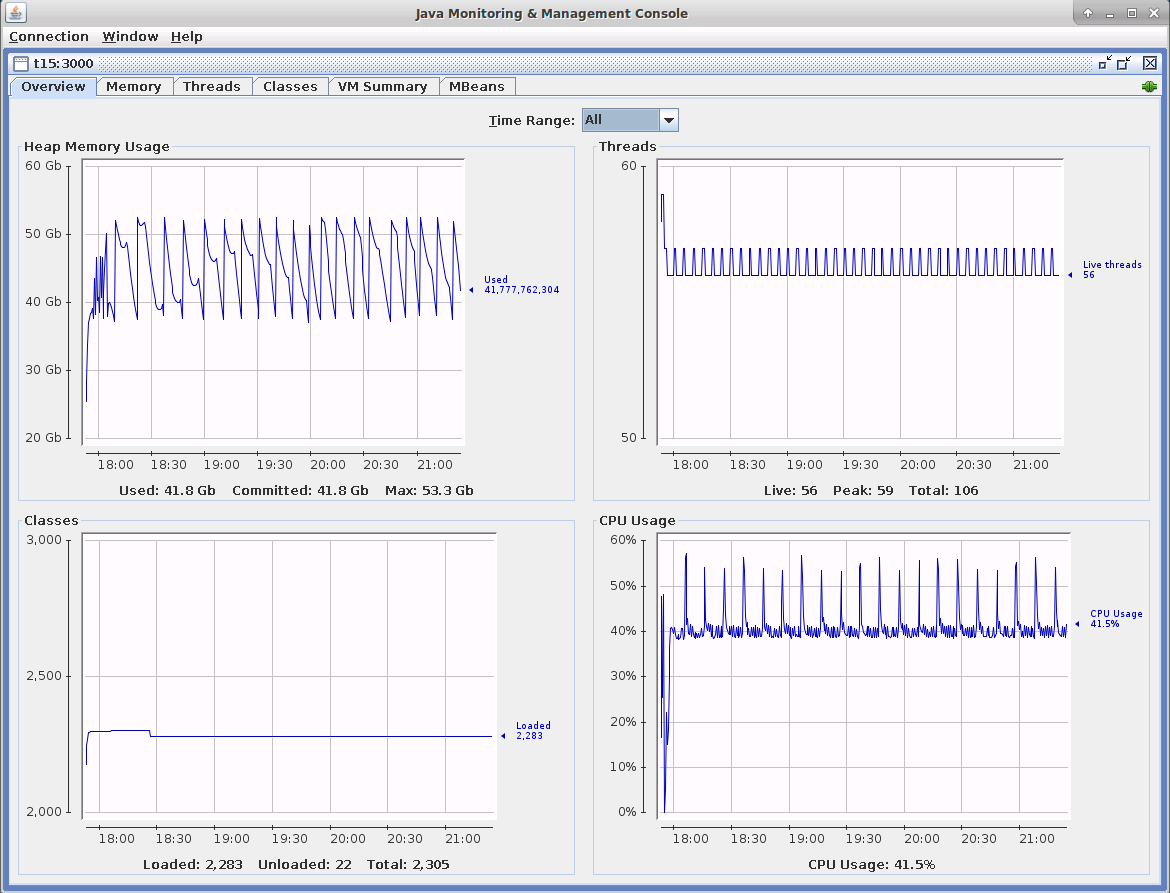
Memory and CPU Utilization
In the screenshot below, you can see the Memory and CPU usage during the benchmark test. The CPU usage is similar to that of the previous C10M benchmark excepting the CPU spikes. The spikes up to 100% produced by the Full GCs in the previous C10M benchmark are now reduced at under 55%.
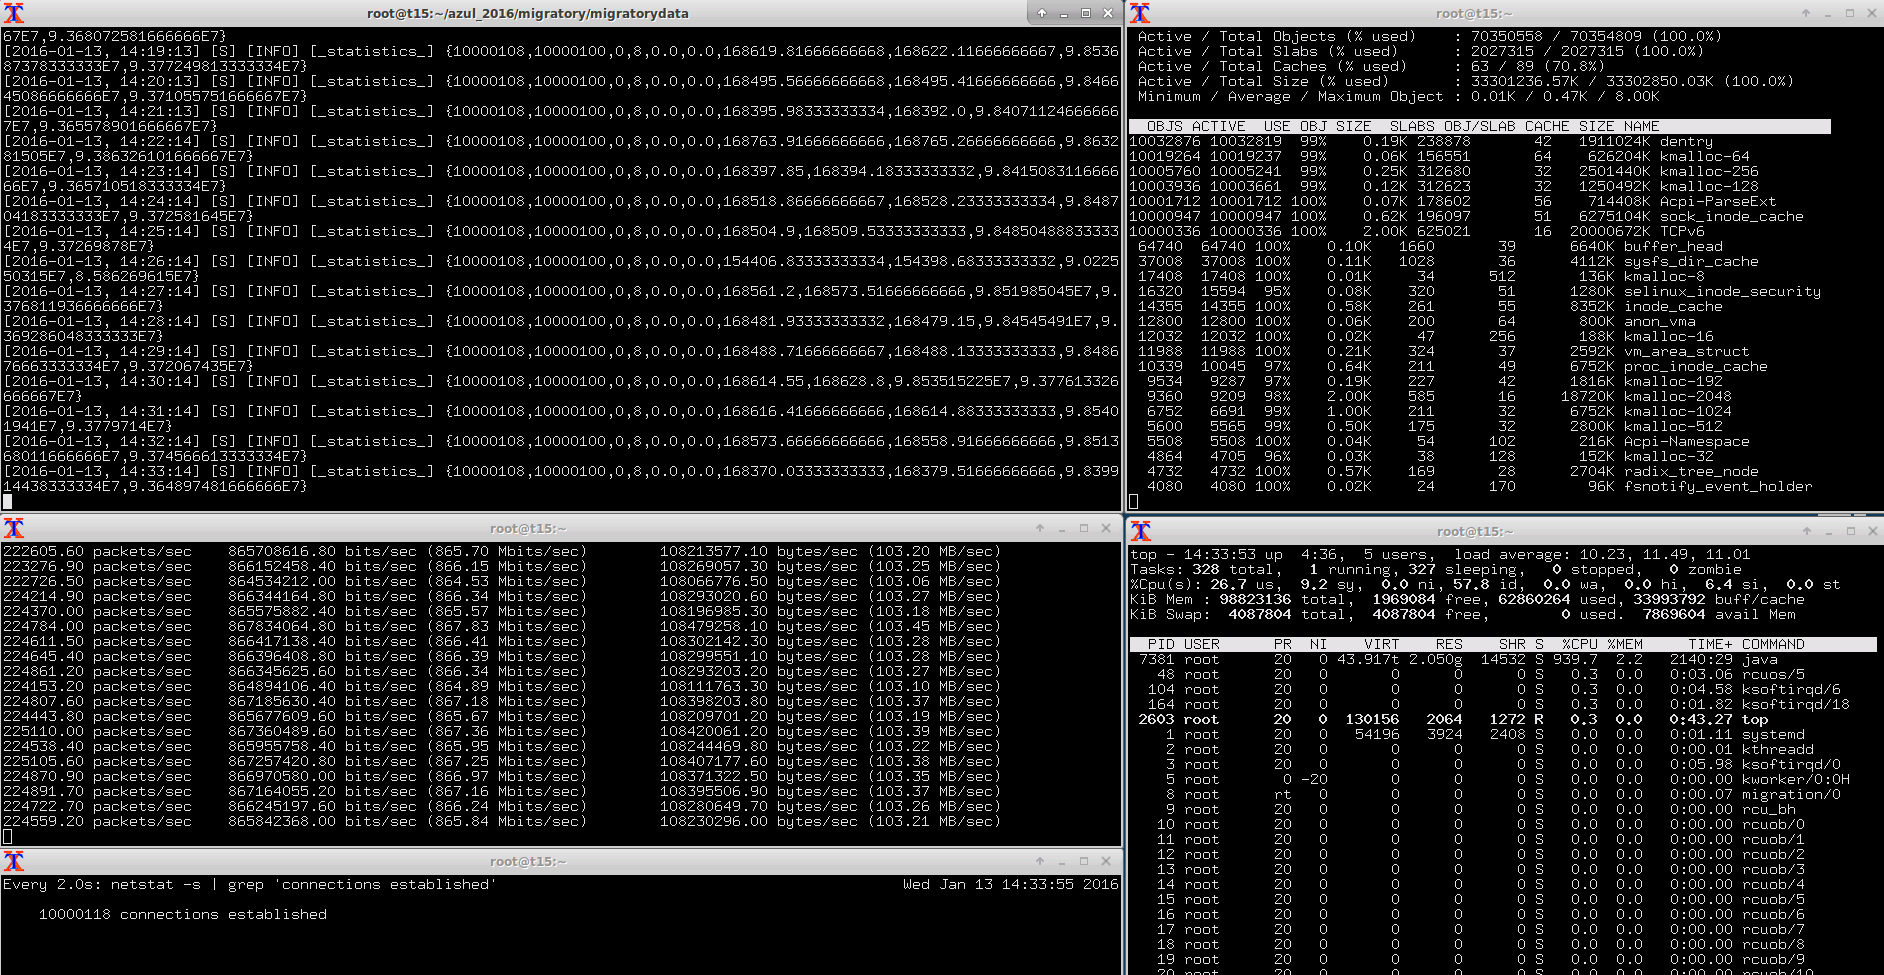
Network Utilization
As you can see in the screenshot below, sending a 512-byte message to each of 10 million clients every minute produced a total outgoing bandwidth from server to subscribers of 103 MB/s or 0.8 Gbps. This total bandwidth includes the 512-byte payload of each of the 168,000 messages sent every second to the subscribers, the overhead added by the TCP and MigratoryData protocol for each message, as well as certain traffic produced by the ssh sessions, JMX monitoring, and the TCP acknowledgements sent by the MigratoryData server to publishers for the received messages. Therefore, the overhead introduced by the TCP and MigratoryData protocol was under 131 bytes per message.
This screenshot also shows the top and slabtop information, and the number of sockets as reported by the netstat tool.
Latency
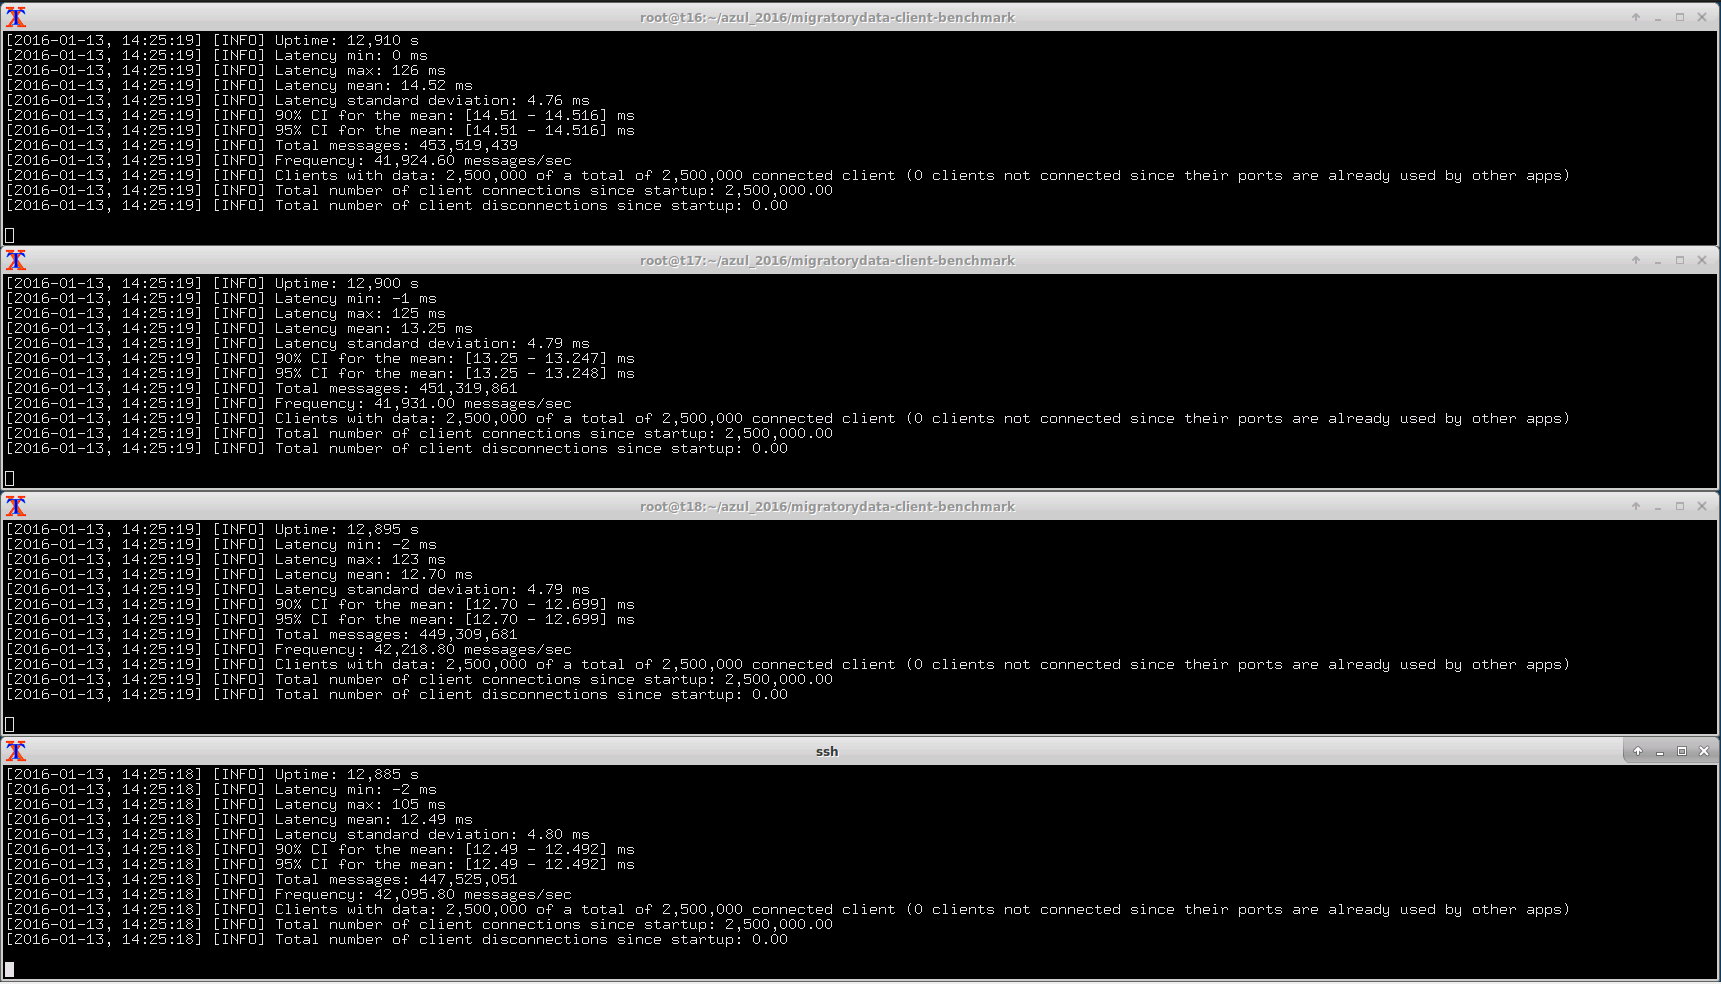
As defined in the Benchmark Setup section above, latency is the time needed for a message to propagate from the publisher to the subscriber, via the MigratoryData server. When Benchpub creates a message it includes the creation time as part of it. In this way, Benchsub can compute the latency as the difference between the creation and reception times of the messages. Because the machines were synchronized with ntp, which did not run long enough for perfect time synchronization, we can observe 1-2 milliseconds time differences between publisher machines and subscribers machines (see the negative values of “Latency Min” in the screenshot).
In addition to computing the latency for all messages received, Benchsub also calculates the average, standard deviation, and maximum. These latency statistics are computed incrementally for each new message received. In this way, the statistics are obtained for all messages received, and not just for a sample size.
In the screenshot below, the “Total messages” information shows that each of the four Benchsub instances received around 450 millions messages during more than 3 hours of benchmark test running. Hence, the following latency statistics are accurate, being computed on the entire population of about 1.8 billion messages (up to the ntp time difference of 1-2 milliseconds):
- Latency Mean is 13.24 milliseconds
- Latency Standard Deviation is 4.7 milliseconds
- Latency Maximum is 126 milliseconds
More Latency Statistics
In the previous section we explained that the latency statistics – mean, standard deviation, and maximum – were computed for all messages received by all 10 million clients. However, other stats that would be interesting to look at for a real-time service, including the median, the 95th percentile and the 99th percentile, cannot be computed incrementally. We need all latency values in order to be able to compute such extra statistics. Recording 1.8 billion latency values is not practical during a performance test, so we used sampling to estimate these additional statistics.
As mentioned in the Benchmark Setup section, we used a fifth Benchsub instance to collect samples for 100 concurrent users from the entire population of 10 million. Each of the 100 users subscribed to a randomly selected subject from the 10 million subjects available.
We recorded all latency values for each of the 100 users for more than 3 hours during the benchmark test. Since each user received an average of one message per minute, we computed and recorded approximately 200 latency values for each user. Subsequently, we computed the median, average, 95th percentile, and 99th percentile for each of the 100 users (detailed results are available here).
Finally, we calculated a 99% confidence interval and we can estimate that, should we repeat the test, there is a 99% probability that the average value would be as follows:
- Median Latency: 13.80 ms ± 0.14 ms
- Mean Latency: 13.33 ms ± 0.12 ms
- 95th Percentile Latency: 21.27 ms ± 0.20 ms
- 99th Percentile Latency: 24.44 ms ± 0.47 ms
Conclusion
We showed here that MigratoryData Server can achieve simultaneously both extreme high-scalability and consistent low latency - delivering real-time data to 10 million concurrent users with under 15 ms average latency, under 25 ms 99th percentile latency, and 126 ms maximum latency for the worst case (computed from a total of 1.8 billion latency values!) - provided that a properly tuned JVM for short garbage collection pauses is used, such as Zing JVM.